Infographics

16 total results
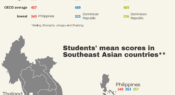
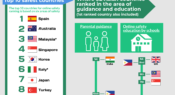
Infographic: How students in Southeast Asia performed in PISA 2018

Today's infographic gives a global snapshot of the highest and lowest performing countries from PISA 2018 in reading, mathematics and science, and how they compare with students’ scores in Indonesia, Malaysia, Singapore, Brunei, Thailand and the Philippines.

Infographic: Child online safety in Southeast Asia

Results of a cyber safety survey of 145 426 children and adolescents, conducted over three years with respondents from 30 different countries, have recently been released. Here are some of the global findings, and where participating countries in Southeast Asia ranked in guidance and education.

Infographic: Teenage career expectations over time

A new report from the OECD explores the career aspirations of 15-year-olds from across the world. In this infographic, we look at the percentage of boys and girls expecting to work in one of the 10 most commonly cited jobs when they are 30 years old, and how their career choices have changed over time.

Infographic: Teacher status around the world

A global survey asked members of the public in 35 countries about their attitudes to teachers and teaching, with data used to create a ‘status index’ score out of 100. Today’s infographic looks at the 15 countries where teachers are most valued, according to their score.

Infographic: Wise words on relationships

In the annual Teacher survey, we ask readers: 'Looking back on your experiences as an educator, if you could share one piece of advice with your peers what would it be?' Here are some of the responses received on the topic of relationships.

Infographic: Classroom seating arrangements

Are you ‘old school’ when it comes to your classroom seating layout? Do you prefer small groups or an arrangement that leaves space in the middle? Here are just a few of the many (many) variations out there.