Infographics

16 total results
Infographic: From one teacher to another – planning

In our annual Teacher magazine reader survey, we ask you to share one piece of advice with a fellow educator. In this infographic, we share some of the responses we received about planning.

Infographic: Student reading in a digital age

An OECD report 21st-Century Readers: Developing Literacy Skills in a Digital World analyses data from the 2018 PISA test and student survey to report on the reading habits of 15-year-olds in OECD countries. Find out more about how reading in digital and paper formats affects students’ reading performance and enjoyment in today's infographic.

Infographic: The impact of COVID-19 on education

The Responses to Educational Disruption Survey (REDS) explores how the pandemic has impacted lower secondary education, investigating how 11 countries approached the challenge of ensuring continuity in teaching and learning during the disruption. Find out more about insights from the survey in today's infographic.

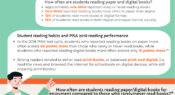
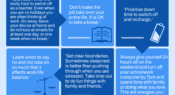
Infographic: From one teacher to another – switching off from work

In our annual Teacher magazine reader survey, we ask you to share one piece of advice with a fellow educator. As the school holidays approach, in this infographic, we share some of the responses we received about the importance of switching off from work.

Infographic: Having a desk and a quiet place to study

Whether it's completing homework assignments, preparing for exams, or being required to study remotely during the COVID-19 pandemic, teenage students often need to complete school work at home. But, how many have access to a desk and a quiet place to study? What about those from the most disadvantaged backgrounds?

Infographic: Teacher attitudes towards STEM

Teachers can have a key influence on the career choices of young people, so knowing their attitudes towards STEM can help us understand how students are being influenced in the school environment. Here, we share results of a survey capturing teacher attitudes towards STEM.

Infographic: Issues hindering school instruction

In the Southeast Asia Primary Learning Metrics (SEA-PLM) 2019 assessment programme, school principals were asked about issues that hindered their school’s capacity to provide instruction. This infographic shows the proportions of children in the six SEA-PLM 2019 countries who attended a school where the principal reported each issue hindered school capacity to a 'large' or 'moderate' extent.

Infographic: Teachers who work second jobs

A new paper explores US data on public school teachers working a second job, outside the education system. What proportion of full-time teachers worked a second job? What type of jobs did they take? And, what were their average earnings? Find out in this infographic.

Infographic: Effectiveness of remote learning during COVID

McKinsey surveyed teachers around the world for their views on the effectiveness of remote learning during the COVID-19 school closures. Teachers were asked to reflect on their experiences in the first few months of the pandemic, scoring the effectiveness on a scale of one to 10. Find out the results in today’s infographic.

Infographic: My Teacher alphabet #1

What do you need information on? Online learning? How to support your students after the COVID-19 school closures? School leadership? How to introduce higher order thinking skills into your lesson planning? This Teacher alphabet brings you quick links to popular content from our Southeast Asia site that you might find useful.