Mapping progress – using data for teaching and learning

It is easy to be overwhelmed by data. And the situation is poised to become worse as new technologies enable the capture of increasingly detailed information about what takes place inside and outside classrooms.
Already there is talk not only of recording what students do, but also of capturing conversations, social interactions and even facial expressions.
Companies offer to analyse the ‘big data sets' that schools can now generate with the promise of discovering what teachers may not already know. Whether this leads to important new insights remains to be seen.
Purposeful data collection
In the meantime, the collection of educational data serves three vital purposes in schools:
- identifying starting points
- monitoring improvement, and
- evaluating effectiveness.
Identifying starting points
Schools use data to establish and understand where students are in their learning. This usually means establishing what students know, understand and can do at the time of assessment – questions that can be answered in varying degrees of diagnostic detail. A good understanding of where students are in their learning is essential for identifying appropriate starting points for action.
This is true for classroom teachers in targeting teaching on individuals' levels of readiness and learning needs and in setting appropriate stretch goals for further learning. But it also is true for school leaders, system managers and governments.
Effective decision-making at all levels depends on a good understanding of the status quo, which may include an understanding of how different groups of students are performing or how student performances compare with performances in other places.
Monitoring improvement
Schools use data to monitor progress over time. The most direct way of establishing whether successful learning has occurred is to monitor changes in what students know, understand and can do. The amount of learning that has occurred can be measured as the progress or growth that students have made. A basic expectation should be that every student will make excellent progress in their learning – for example, over the course of a school year – regardless of their starting point. Reliable information about change over time is also required by education leaders to judge whether standards are declining or improving in schools and school systems.
Evaluating effectiveness
Schools use data to evaluate the effectiveness of interventions. Data are required by teachers to judge whether particular teaching strategies have resulted in better learning. If one teaching strategy is more effective than another, the most direct evidence of that will be a difference in the improvements they have produced.
The evaluation of educational programs and materials also depends on carefully collected data that can be used to measure improvement. And school and system leaders use data to evaluate the impact of school-wide and system-wide programs and initiatives to raise achievement levels and close equity gaps.
A frame of reference
These three central uses of data in school education all require an appropriate frame of reference for interpreting data. A useful analogy is the monitoring of a person's journey through physical terrain. To establish and understand where a person is on their journey at any given time and to monitor the progress they are making, an understanding – ideally a map – is required of the terrain through which they are travelling. In much the same way, to establish where students are in their learning, to monitor progress over time and to evaluate the impact of interventions on learning progress, a ‘map' is required of the learning domain through which students are progressing.
A map makes it possible not only to monitor progress, but also to describe what progress looks like. It does more than locate a person in terms of numerical coordinates, it describes the kinds of observations that can be expected at that point in a person's progress. A map of a learning domain describes increasing levels of knowledge, skill and understanding. The fundamental purpose of assessment is to establish where students are in their long-term progress through such a domain.
ACER's progressive achievement scales
The progressive achievement scales that the Australian Council for Educational Research (ACER) has developed in reading, mathematics and several other learning areas are examples of ‘maps' of learning domains. The map that underpins the Progressive Achievement Tests in Mathematics (PAT-M) is shown below.
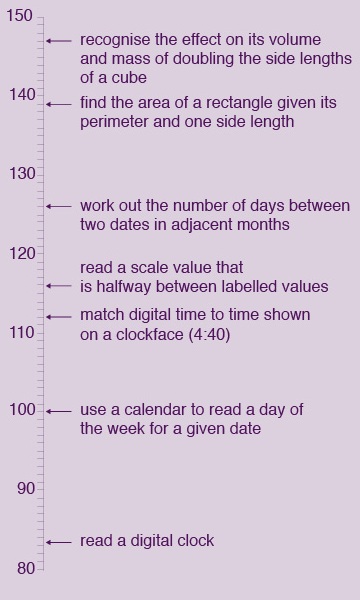
[Some tasks on the PAT-M progressive achievement scale.]
Increasing mathematics achievement is reflected in progress up the scale. A small number of PAT-M tasks are shown here and, when read from the bottom up, give a sense of students' increasing skill levels in one aspect of mathematics: using units of measurement.
When schools use ACER's Progressive Achievement Tests (PAT) they are provided with information about where individuals are in their learning progress, both quantitatively as a position on a numerical scale and qualitatively in terms of the kinds of skills demonstrated at that level of achievement. When schools test on more than one occasion they can measure the progress – or growth – of students over time. And, by comparing rates of growth, schools are able to evaluate the effectiveness of different teaching strategies and interventions. All three uses of PAT data play an essential role in effective teaching and learning.
International progressive achievement testing
Progressive achievement scales have been developed for a range of ACER's tests:
- the PATs in Australia
- the Essential Learning Metrics (ELMs) in England
- the Indian Progressive Achievement Scales (IPAS), and
- the Progressive Achievement Scales- Middle East (PAS-ME).
These progressive achievement scales provide both quantitative and qualitative data on student progress that can be used to diagnose strengths and weaknesses, monitor learning progress or growth over time, and determine next steps in teaching and learning.
In Australia, PATs have been developed for:
- Mathematics
- Reading
- Spelling
- Punctuation and Grammar, and
- Science.
These tests are available both in paper form and online, and are suitable for students from Years 1 to 10.
In England, tests in the ELMs suite have been developed for Mathematics and Reading Comprehension. These tests, available online, address England's new National Curriculum and are suitable for students from Years 2 to 10.
In India, tests in the IPAS suite have been developed for:
- Mathematics
- Reading Comprehension
- Science, and
- General Ability.
These tests are available both in paper form and online, and are suitable for students from Years 2 to 10.
In the Middle East, PAS-ME suite is in development for:
- Mathematics
- Reading Comprehension
- Science, and
- General Ability.
These tests will be suitable for schools following the curriculum of India's Central Board of Secondary Education and National Curriculum of England.
To be available online, the PAS-ME suite of tests will be suitable for students from Years 2 to 10.
All these tests provide valuable data that teachers can use to establish where students are in their long-term learning, diagnose individual strengths and weaknesses, identify the best next steps for action, decide on appropriate evidence-based interventions, monitor the progress students make over time, and evaluate the effectiveness of their own teaching decisions and approaches.
This article first appeared in International Developments Issue 6.
Further information
Progressive Achievement Tests: www.acer.edu.au/pat
Essential Learning Metrics: www.elms.aceruk.org
Indian Progressive Achievement Scales: ipas.acer.edu.au