The Global Academic Challenge offers Australian students in Years 4, 6 and 8 the opportunity to apply their skills and knowledge beyond the curriculum across Mathematics, Reading and Science. It’s designed to stretch higher-performing students and to offer teachers greater insights into their learning, including their relative strengths and weaknesses. In this article, ACER Senior Research Fellow Frances Eveleigh – who led the development of the challenge – shares some of the insights.
Held for the first time in March 2022, more than 2,000 students from around the country took part in the Global Academic Challenge.
Developed by the Australian Council for Educational Research (ACER), the challenge is comprised of a 60-minute assessment for each learning area and provides Australian students with the chance to attempt the kinds of questions sat by students in international schools around the world. The competition draws upon ACER’s international assessments and is based on the framework for the OECD’s Programme for International Student Assessment (PISA).
Because the challenge is informed by these international assessments, we can see how students’ performance compares not only to other participating students around Australia, but also internationally. It’s these comparisons that help us to look more closely at the performance of the challenge cohort and, over time, observe possible trends. And, although we can’t say these results are indicative of student achievement across the country, they still provide valuable insights.
Interestingly, the results for the Reading challenge revealed very few differences in reading ability between the Australian participating cohorts and the international cohort, so we’ll focus on the Mathematics and Science challenges, summarising where Australian students excelled and reviewing skills for improvement.
Student performance in Mathematics
In the Mathematics section, students were presented with questions set in real-life contexts. In this learning area, Australian cohorts were, in general, more successful than their international counterparts when answering questions in the content areas of space and shape and uncertainty and data.
In particular, our Year 4 and Year 6 students performed well on questions related to 3D-objects and visualising and comparing angles. Our Year 8 students demonstrated strong skills when working with probability and proportional reasoning in more complex problems.
Interestingly, our Australian cohort’s results showed that our students may have some further work to do to match the achievements of international students in the content area of quantity, with our Year 6 students weaker on questions involving calculations of rate (using graphed population data and percentages), and our Year 8 students underperforming on solving problems related to calculating area.
Let’s take a closer look at what kinds of questions these included. The below question appeared in the Year 6 challenge and involved students using their knowledge of calculating rate. One third of our Year 6 students answered this question correctly by selecting option C.
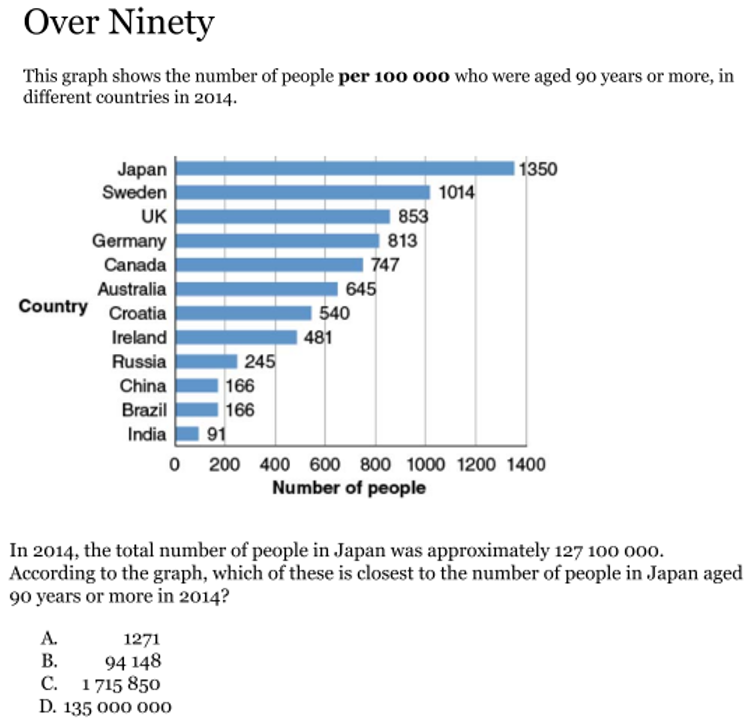
The question is based on real-world data and tests whether students can first determine a percentage or rate, and then apply this rate to another larger number to calculate the answer.
Option A was the most popular incorrect answer selected, possibly by students who had little understanding of the graph and the question asked. These students most likely matched the ‘1271’ with ‘127 100 000', the largest number in the question.
Students who selected option B reveal partial understanding of the overall process. They divide the Japanese total population by the number of people aged over 90, in an attempt to use knowledge of calculating a percentage, but do not fully understand what the question is asking, or the steps required to solve the problem. Option D was most likely selected by students who misinterpreted the first sentence as ‘number of people (hundred-thousands)’, believing the ‘1350’ on the graph represented 1 350 000 000.
Given the range of the 4 options, some students may have been able to determine the answer by approximating the first rate then applying the ratio to the larger value, without the need for more exacting calculations. Students should be encouraged to look for reasonable estimations to determine answers and also to check the logic of their calculated answers.
For the Year 8 challenge, we can take a closer look at the below question where students had to solve a problem relating to calculating area. With 43% of the Australian Year 8 cohort able to find the answer to this open response question correctly, our students found this question more challenging than their international peers.
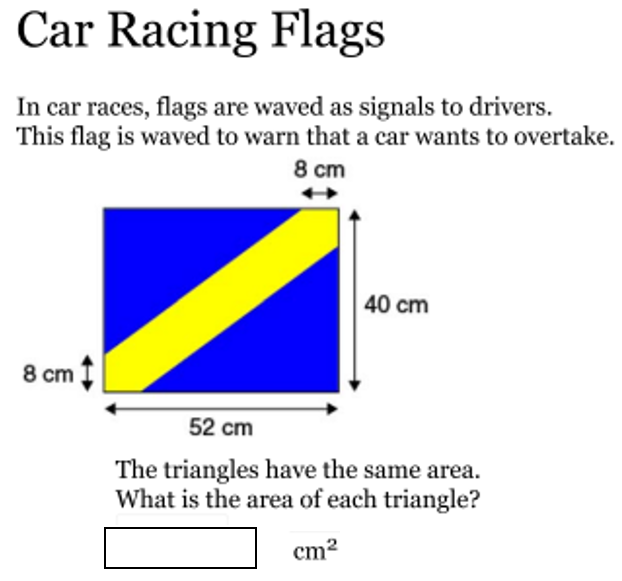
The diagram needs to be carefully considered, and the fact that the triangles have the same area understood.
Some students will use visualisation and reasoning to solve this question. Recognising that both hypotenuses are equal, and by removing the central diagonal yellow shape, the 2 triangles can be brought together to form a rectangle. Mentally calculating, 44 x 32, then dividing by 2, the solution is quickly determined.
For this type of item, and under test conditions, it is very easy to omit the last step (in this case, divide by 2) and answer incorrectly. Students should also develop the habit of rereading questions to check the reasonableness of their answers.
You can practise this type of activity with real paper shapes, asking students to cut and move shapes to form larger ones, and calculate the area. Alternatively, students can create their own digital shapes and move and transform to make larger, more complex shapes for area calculations.
Student performance in Science
In Science, our Australian students in all 3 year levels performed comparatively stronger than the international reference group when asked to interpret data and evidence scientifically.
Our Year 6 students also showed greater ability to evaluate and design scientific enquiry. Explaining phenomena scientifically was shown to be a competency for greater focus in our Australian participating schools, with the international students showing comparatively greater strength across Years 4, 6 and 8.
In this example taken from a unit about helium balloons, which tests students’ understanding of the behaviours of matter, just over half of the Year 6 students in the Australian cohort answered correctly.
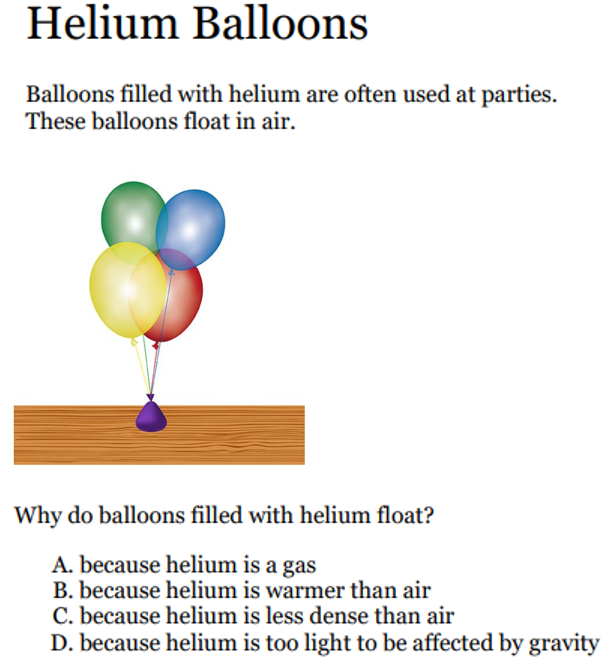
Most students would be familiar with the everyday context and be able to draw on their own experiences of seeing or handling helium balloons.
The 4 options follow the same structure giving a statement that potentially explains why the balloon floats. Attracting around one in every 8 students, option A, although a correct property of helium, does not answer the question. Option B was the least popular option. Interestingly option D was selected by more than a quarter of the participating students. These students were likely attracted by the word ‘light’, but this answer reveals the misconception that something, in this case helium, could be too light to be affected by gravity. The correct answer, option C was selected by just over half the Year 6 Australian cohort, with this question seemingly easier for Year 6 students internationally.
In another example where the competency of Explaining Scientific Phenomena was assessed, our Year 6 students showed some uncertainty when asked to think about what causes day and night on Mars.
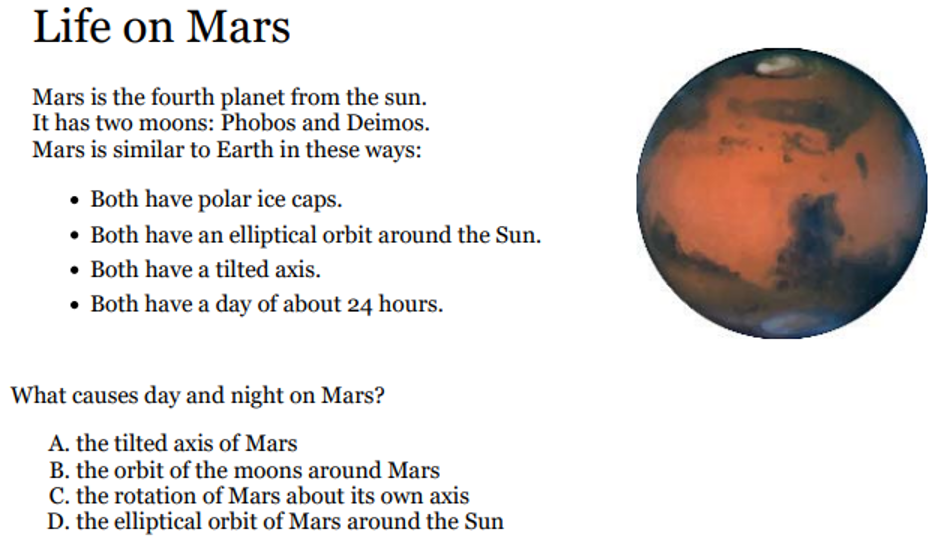
This question revealed that just over a third of the Australian Year 6 participants could apply their understanding of the Earth's spin to a new context, correctly selecting option C.
However, a larger percentage of students selected option D, holding the misconception that day and night is a result of the orbit of Mars around the Sun. Around 10% of students selected option A, believing that Mars’ tilted axis resulted in day and night, showing confusion with the seasons; and a similar percentage of students were confused with the effect of the orbit of Mars’ moons, incorrectly selecting option B.
Activities that allow students to create and draw, provide correct labels and descriptions of the Earth, Moon and Sun, model relative sizes and distances, along with opportunities to explain and reason, allow students to gradually develop the understanding that the Earth is part of a system.
The Global Academic Challenge takes place annually. To participate in next year’s competition in May 2023, visit www.acer.org/global-academic-challenge and register your school.
As a lower secondary Mathematics teacher, consider the question on car racing flags from the Year 8 Mathematics challenge where 43% of participants were unable to select the correct answer.
Have your students had the opportunity to tackle a question like this? If not, how could you incorporate an activity using real paper shapes, as suggested by Frances Eveleigh, the next time you are focusing on calculating area with students? Or, would digital shapes be more appropriate and/or engaging for your class?