Do you let students plan and carry out their own science investigations? Do you provide opportunities for in-depth discussions about science topics? How often do your primary students have science lessons?
A new national report explores latest achievement data for students’ science literacy, and offers insights into what’s happening in Australian classrooms to help develop their knowledge, understanding and inquiry skills
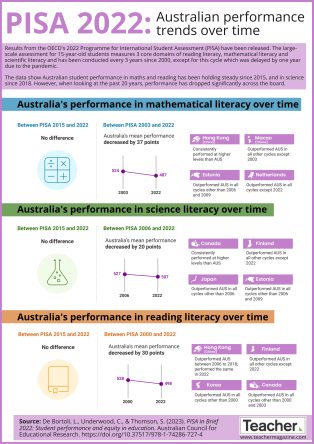
The National Assessment Program – Science Literacy (NAP-SL) public report, released this week by the Australian Curriculum, Assessment and Reporting Authority (ACARA), shows 43% of year 6 students and 46% of year 10 students failed to achieve the proficient standard in the 2023 test cycle.
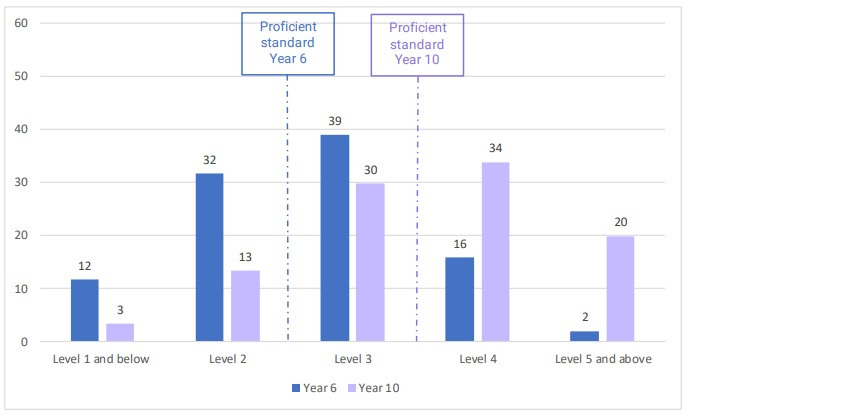
Percentages of year 6 and year 10 students across proficiency levels in 2023. Results are rounded to the nearest whole number. [Source: ACARA, 2024. Figure 4.1]
The report notes that, nationally, there’s been no significant change in science literacy achievement since the proficient standard was established for year 6 and year 10 (in 2006 and 2018, respectively).
Looking closer at the year 6 data according to jurisdiction, the proportion of students achieving the standard ranged from 42% in the Northern Territory to 69% in the Australian Capital Territory. At year 10, some states and territories opted out of sampling sufficient schools for reporting by jurisdiction, contributing to national data only.
There were also differences according to students’ background. One in 3 Indigenous year 6 students (34%, up from 26% in 2006) and one in 4 Indigenous year 10s (28%, up from 20% in 2018) achieved the proficient standard in the 2023 test.
While changes in classification for geographic location prevent comparisons with previous test cycles, this latest data show 59% of year 6 students in major cities, and 58% of their year 10 counterparts reached the proficient standard. For students in regional areas, the figures were 51% and 42%, respectively. There were not enough year 10 participants in remote areas, so that figure couldn’t be reported, but at year 6 42% of students in remote areas achieved the national standard.
Parental education and profession also had an impact. Around 7 out of 10 students in both year groups who had at least one parent in the highest occupational group achieved the proficient standard – for students with parents in the lowest occupation group, this fell to 41% attainment for year 6 and 34% for year 10. On the measure of parental education, around 7 out of 10 students with at least one parent holding a bachelor’s degree or above attained the standard compared to less than 50% of students whose parent’s highest education level was year 12 or equivalent.
Frequency of science lessons
As part of the NAP-SL questionnaire, year 6 students were asked how often they have science lessons at school. They were given the following definition for clarity. ‘A science lesson is a lesson with any teacher where you explore how and why things happen. In science lessons, you do experiments, collect information, or talk about scientific ideas.’
Nationally, 5% of respondents said they ‘never’ have science lessons, and 9% said they happened ‘once a month or less’. The majority (48%) reported having science lessons ‘once a week’, and 22% chose ‘more than once a week’.
Looking into the state and territory breakdown there are some stark differences. Only 10% of year 6 students in Victoria said they have science lessons more than once a week (the lowest proportion by jurisdiction) compared with 45% in Queensland (the highest). Indeed, in Victoria, 14% said they ‘never’ have science lessons and 21% said it was ‘once a month or less’.
In the classroom and at home
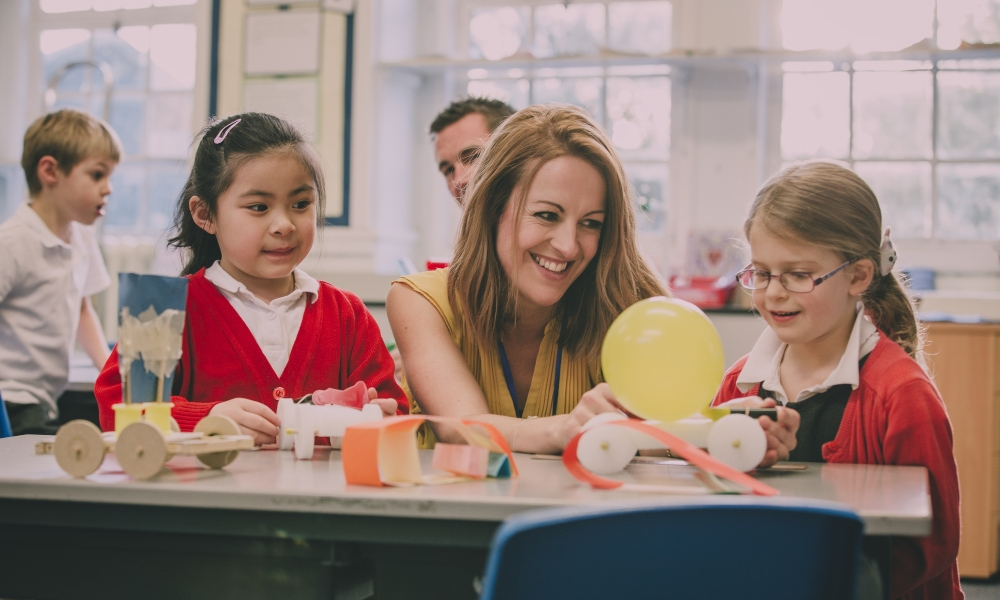
‘Effective classroom practices in science foster the critical thinking and problem-solving skills that are vital for students to understand and apply scientific concepts,’ the report says. With this in mind, the questionnaire measured participants ‘exposure to enriching and experiential learning while also exploring how students evaluate the clarity of pedagogical practice in their classroom’.
On the topic of external input, only 38% of year 6 students and 20% of year 10s reported going on science-related excursions, and less than a quarter of students in both year groups said their teacher invites visitors to class to talk about science topics.
When it came to student perceptions of clarity of scientific instruction, 82% of year 6 students and 77% of year 10 students agreed that their teacher explains scientific concepts clearly to their class.
Students who reported engaging more frequently in Critical and Creative Thinking (CCT) activities tended to have higher levels of science literacy. In year 6, the most frequently reported CCT-related activity was being encouraged to ‘explain the reasons why I did something’ – 71% said they ‘mostly or always’ did this in science lessons. The second most reported (69%) was ‘my teacher encourages me to think through all the different options when making decisions’. However, the report adds: ‘On the other end of the spectrum, only 49% of year 6 students reported having “in-depth discussions about science ideas” in their science lessons, with 12% of students reporting that they never did this.’
In year 10, two-thirds (65%) of students reported ‘mostly’ or ‘always’ using a computer or tablet device for science-related research, while 39% said teachers ‘mostly’ or ‘always’ asked them to brainstorm ideas. On the question of in-depth discussions about science ideas, 15% of year 10s reported ‘never’ having them and a similar proportion (17%) reported never getting to plan and carry out their own science investigations.
Offering pointers on the benefits of activities outside school, the report says: ‘Family support for CCT was positively associated with student achievement in science literacy. This was true in both year 6 and year 10 and for both male and female students.
‘Year 10 students who more frequently participated in science-related activities outside of school (for example, “Talk about science with my family”) tended to perform better on the NAP–SL assessment.’
Stay tuned: We’ll be delving deeper into the findings from the NAP-SL 2023 public report in a future article.
References
ACARA. 2024. NAP–Science Literacy 2023 Public Report. https://www.nap.edu.au/nap-sample-assessments/results-and-reports
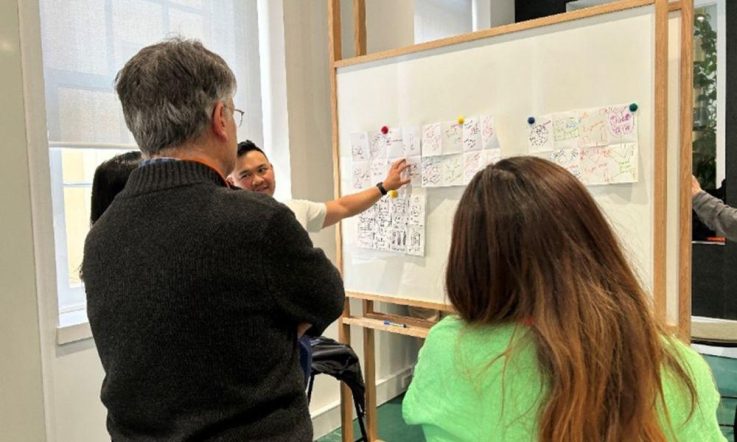
The latest NAP-SL report found less than half the year 6 or year 10 students surveyed reported having ‘in-depth discussions about science ideas’ in their science lessons and 12% said they never did this.
How often does this happen in your own lessons? Is this something you include into your planning? If you’re not having in-depth discussions, why do you think this is? What are the challenges? How could you work with colleagues to overcome these?