What sort of schools have the best access to teachers?

The most recent Australian report from the Programme for International Student Assessment (PISA) presented evidence that socioeconomically disadvantaged students [1] in Australia were achieving at a level about three years behind their socioeconomically advantaged peers. In terms of proficiency, 57 per cent of disadvantaged students were not achieving at the National Proficient Standard (set by ACARA as the minimum expectation of student achievement), compared to 21 per cent of advantaged students.
This is not a new finding – in every previous Australian PISA report similar gaps have been reported. In other international studies such as the Trends in International Mathematics and Science Study (TIMSS) and the Progress in International Literacy Study (PIRLS), substantial differences in achievement have also been reported between students with few books in the home and those with many books in the home, and between students with few educational resources available to them and those with many such resources. All of these findings point to a student's personal lack of resources as being a major factor inhibiting the achievement of our most disadvantaged young people.
Schools, it is argued, can provide students from a low socioeconomic background with the resources and opportunities they need to succeed, thus improving the fairness of the educational system and reducing educational disadvantage – one of the primary tenets of the Melbourne Declaration on Educational Goals for Young Australians (Australian Curriculum, 2009). However the OECD argues that education systems may, perhaps inadvertently, 'increase inequity … by offering a common resource harvested by those who are best prepared for it' (Field, 2007, p. 132).
Access to resources in terms of quality and quantity of teaching and assisting staff was measured in PISA 2015 by asking principals to report on the extent to which their schools' capacity to provide instruction was hindered by a shortage of such staff, with responses on a four-point scale that ranged from not at all to a lot. These scores are transformed into an index score which is scaled with zero representing the mean over the whole OECD, and a standard deviation of 1. Scores higher than zero indicate that principals perceived the impact on their school's instruction to be greater than on average across the OECD. Scores lower than zero indicate that principals perceived it as less of a problem than on average across the OECD. When interpreting these findings, it should be kept in mind that principals did not provide an objective measure of the provision of teachers or teaching assistants, but rather the impact they perceived that a shortage had on their school's capacity to deliver instruction.
Figure 1 shows the differences between the index scores of advantaged and disadvantaged schools across OECD countries. Scores above the horizontal line indicates that disadvantaged schools in the country have a higher level of teaching resources than advantaged schools, and those below the line the reverse.
It can be seen from Figure 1 that Australian principals reported the largest disparity in the provision of teacher resources across the OECD in PISA 2015, meaning that principals of disadvantaged schools in Australia reported significantly higher levels of teacher shortage than on average across the OECD, while those at advantaged schools reported significantly lower levels. Principals in Spain, Turkey and the United States also reported that disadvantaged schools had significantly lower levels of teaching resources than advantaged schools, although the level of disparity was lower than in Australia. In no country was the provision of resources significantly greater in disadvantaged schools, however in Korea, Austria and Estonia, the difference between advantaged and disadvantaged schools was not statistically different.
Click here to view an enlarged version of the graph below.
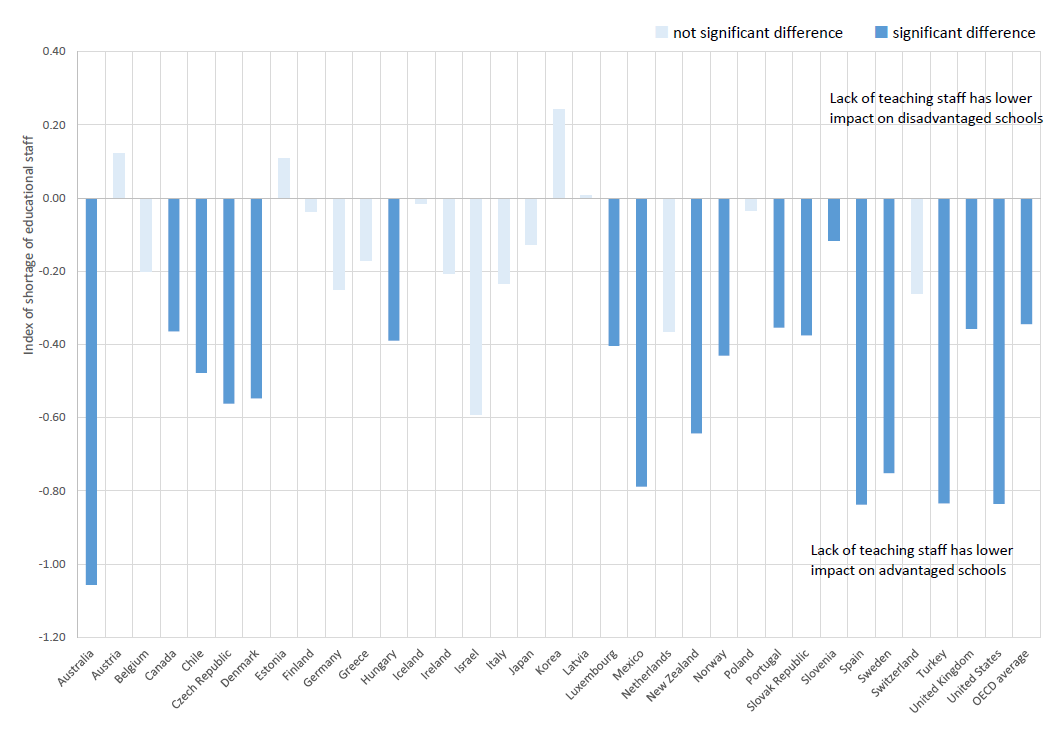
Figure 1: Differences in educational staffing resources between advantaged and disadvantaged schools, PISA 2015.
On each of the items comprising this index, students who attended disadvantaged schools were more likely to have principals who reported that each statement was an issue compared to those from more advantaged schools (Table 1).
Click here to view an enlarged version of the table below.
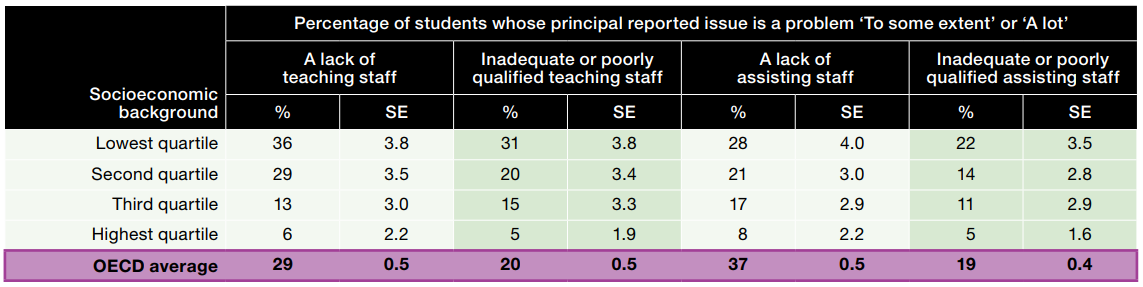
Table 1: Shortage of educational staff, by socioeconomic background.
The greatest problem reported by principals of disadvantaged schools was a lack of teaching staff. Thirty-six per cent of disadvantaged Australian students were attending schools in which the principal reported that a shortage of teachers hindered the school's capacity to provide instruction – compared to just 6 per cent of advantaged students. The common resource harvested by those who are best prepared for it.
Can different allocation of teachers compensate for student disadvantage?
In its most recent report examining teacher policies and practices using PISA data, the OECD found that the majority of countries and economies participating in PISA 2015 make an attempt to compensate for disadvantage in schools with smaller classes and/or lower student-teacher ratios. Australia is not one of those countries. Actually, Australia is the only OECD country in which disadvantaged schools are worse off than advantaged schools in terms of the number of students per teacher in their school. While the ratio doesn't look so bad – for Australia there are 13 students per teacher in disadvantaged schools and 12 students per teacher in advantaged schools – this makes a very large difference when it comes to the average secondary school. In the PISA 2015 school sample, which was a stratified random sample of 758 schools, representative of state, sector and geolocation, the average school size was just under 1000 students. A disadvantaged school with this average population would employ 77 teachers, a similar sized advantaged school 83 teachers. The disadvantaged school, with a much higher proportion of students who need additional help in school, has, on average, six fewer teachers to provide this assistance.
Principals of disadvantaged schools are also more likely than their colleagues in advantaged schools to be staffing science classes with teachers that did not have the appropriate qualification, and Australia was the only OECD country to report that disadvantaged schools had both fewer teachers per student and a smaller proportion of fully certified teachers with a major in science than advantaged schools.
Principals of disadvantaged schools in Australia were also more likely than those in advantaged schools to report that as well as not having enough teachers and enough fully qualified teachers, the ones they had were generally less experienced and less prepared, and had higher rates of absenteeism.
While it may seem difficult given the current systems for teacher employment in Australia, we need to avoid having high concentrations of inexperienced and less- qualified teachers in socioeconomically disadvantaged schools. As an alternative, the OECD suggests examining the Japanese and Korean 'career-based' systems, which have mandatory requirements for teacher mobility and career incentives for teachers who work in high-need schools (see Box 1).
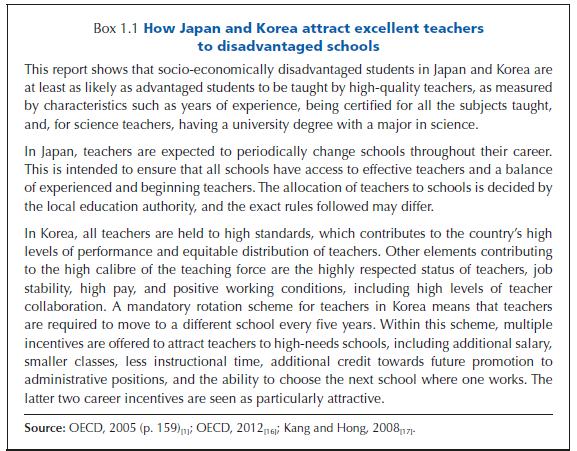
Box 1: OECD (2018) Effective Teacher Policies: Insights from PISA.
[1] Socioeconomic background in PISA is measured using an index of Economic, Social and Cultural Status (ESCS) for each student. Students are considered to be socioeconomically disadvantaged if they can be included in the 25 per cent of students with the lowest ESCS in their country, and socioeconomically advantaged if they can be included in the 25 per cent of students with the highest ESCS in their country.