What does PISA tell us about Australia’s school sectors?

Since 2000, Australia has been among a large number of countries and economies that compares the achievement of its 15-year-old students through the OECD Programme for International Student Assessment (PISA). Every three years, a random selection of students from a random selection of schools (known in research as a ‘sample’) is selected to represent their jurisdiction.
The sampling process for PISA is carefully constructed to ensure that accurate reporting can be carried out not only at the national and state level, but also at the school sector level. Prior to 2009, through a decision of the National Advisory Committee, analysis by school sector for Australia was not reported. This article examines achievement, school climate and student wellbeing in Australia’s three school sectors, including comparisons over time where available.
Mean scores in reading, maths and science
Table 1 shows the mean scores for reading, mathematical and scientific literacy for PISA 2018, the most recent cycle for which results are available. The differences are all significant, with students in independent schools achieving at a higher level than students in Catholic schools, and students in Catholic schools achieving at a higher level than students at government schools.
Table 1. Mean scores for reading, mathematical and scientific literacy, PISA 2018
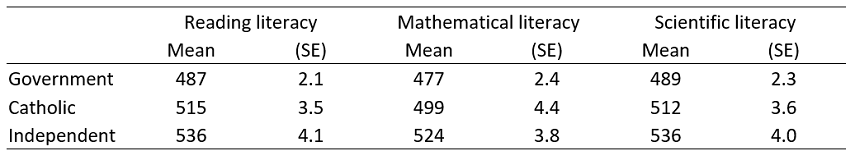
Due to Australia’s large number of participating 15-year-old students, which are spread across multiple year levels, it is possible to estimate the number of score points associated with one additional year of schooling. For example, based on mean reading literacy scores, students in independent schools performed at a level approximately two-thirds of a year of schooling above students in Catholic schools and one-and-a-half years of schooling above students in government schools.
If we were dealing with a system in which students attended their school of choice regardless of sector, then these results would be quite clear. However, this is not the case. Government schools enrol the vast majority of students who fall into government-defined categories of disadvantage, such as low socioeconomic background. Forty-one percent of government schools can be classed as disadvantaged schools, compared to three percent of Catholic and less than one percent of independent schools. In contrast, 10 per cent of government schools, 31 per cent of Catholic schools, and 63 per cent of independent schools, are classed as advantaged schools. Over 80 per cent of disadvantaged students attend government schools.
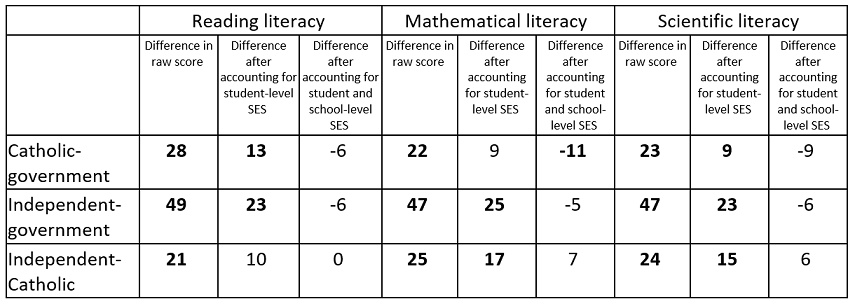
It is important, therefore, to account for disadvantage when looking at these scores. Internationally, PISA has consistently found student achievement is different when reported before accounting for socioeconomic background compared to after. Importantly, analysis with the Australian data show that after accounting for socioeconomic background at both school and student level, few differences remain (Table 2).
Table 2. Differences in mean scores after adjusting for student and school-level socioeconomic background
Decline in scores over time
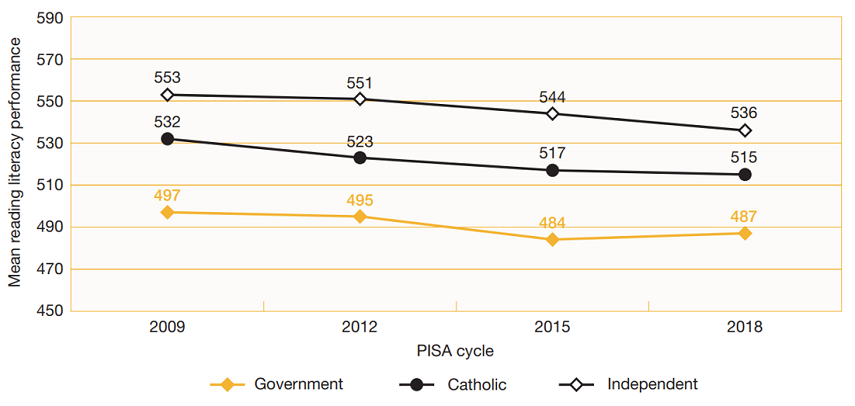
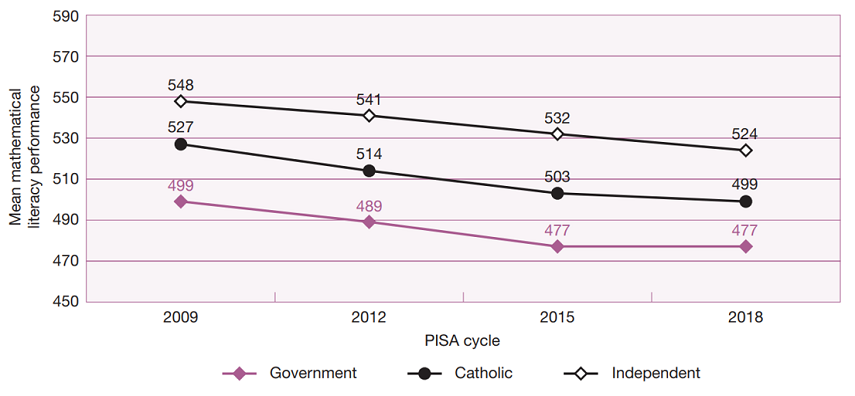
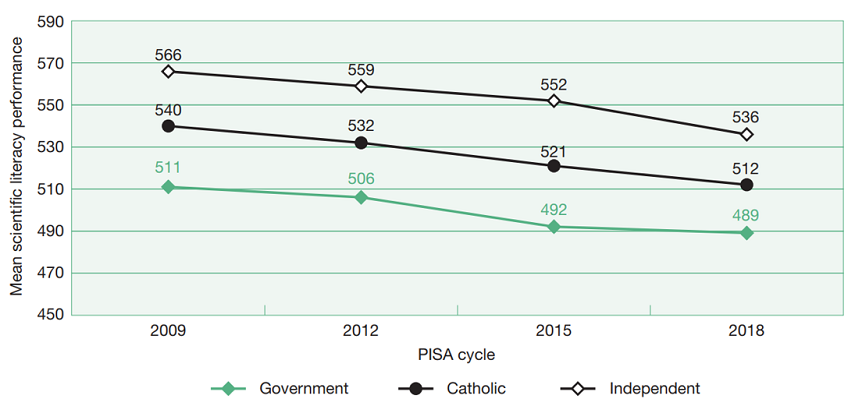
Scores in reading, mathematical and scientific literacy have declined over time for all Australian school sectors (Figure 1). In reading literacy, the decline for government schools of 10 points between 2009 and 2018 was not statistically significant, however the decline in scores for both Catholic schools (17 points) and independent schools (18 points) were both significant.
In mathematical literacy, the scores for students in all sectors declined significantly over 2009 – 2018: in government schools by 22 points, in Catholic schools by 27 points and in independent schools by 24 points. Similarly, for scientific literacy, the scores for students in each sector declined significantly: in government schools by 22 points, in Catholic schools by 28 points and in independent schools by 30 points.
Figure 1. Scores over time in reading, mathematical and scientific literacy, by sector
School climate and student wellbeing
Parents want a positive school environment for their children, and children certainly respond well to such an environment. There is evidence that a positive school climate can, for example, promote students’ academic achievement, wellbeing and self-esteem (MacNeil et al., 2009; Way et al., 2007), and mitigate the strong link between socioeconomic status and academic achievement (Berkowitz et al., 2017). PISA has an extensive framework to examine school climate, based around three pillars: student disruptive behaviour, teaching and learning, and school community. This article will just look at one of the behaviours in each of the pillars – for a full examination of all constructs see Thomson et al., 2020.
Student disruptive behaviour – bullying
International studies have identified bullying in schools as a particular problem, with student reported bullying seemingly more prevalent in Australia than in most other countries in the world. In PISA 2018 the mean index score for Australia was 0.33, compared to an OECD average of 0[1] .
Students in government schools reported more exposure to bullying at school (index score of 0.38) than students in either Catholic (index score of 0.26) or independent schools (index score of 0.26), and for all sectors, the average score was significantly higher than the OECD average.
Over time (2015-18), there were significant changes reported on several of the items that make up this index. In all school sectors, there was a significant increase in the proportion of students who reported that on a regular basis, other students made fun of me, I was threatened by other students, and I got hit or pushed around by other students. For independent schools there were small but significant increases also in the proportions of students who reported other students took away or destroyed things that belonged to me (also a small but significant increase among students in government schools), and other students spread nasty rumours about me.
Teaching and learning – teacher behaviour and student learning
Teacher quality is probably one of the most important school factors for student learning and other student outcomes such as wellbeing. What ‘teacher quality’ means, though, is much disputed. PISA asks principals to report on the extent to which student learning in their school is hindered by particular teacher behaviours: teachers not meeting individual students’ needs; teachers being unprepared for class; teacher absenteeism; teachers resisting change; and teachers being too strict with students.
According to Australian school principals, teaching and learning in their schools takes place in largely positive environments. On average across OECD countries, a majority of students attended schools whose principal reported that the above-mentioned teacher behaviours do not hinder student learning, or hinder it only very little. In Australia, on average, the environment was generally seen as positive (index score of 0.33), significantly higher than the OECD average (0.13). However, 38 per cent of Australian students attended schools in which principals considered that student learning was hindered by teachers not meeting individual student needs, 37 per cent by staff resisting change, and 19 per cent by teacher absenteeism.
There were substantial differences in the reports by school sector. Principals at government schools reported the highest levels of behaviours hindering student learning. The mean index score for government schools was 0.42, for Catholic schools 0.31, and for independent schools 0.02, which was substantially and significantly lower than the OECD average.
Between PISA 2012 and 2018 the biggest changes were in the area of teacher absenteeism, with principals in all school sectors reporting an increase – a six percentage point increase for government schools, an eight percentage point increase for independent schools, and a nine percentage point increase for Catholic schools. The only other significant change was a 12 percentage point increase across independent schools in the percentage of students attending schools in which principals perceived student learning was hindered by teachers not meeting individual students' needs.
School community – sense of belonging
Students at 15 years of age are starting to form strong relationships outside their families, and the school community is an important part of their expanding world. A sense of belonging reflects how accepted, respected and supported students feel in their social context at school (Goodenow & Grady, 1993), and students reporting a strong sense of belonging tend to show higher academic motivation, self-esteem and achievement (Goodenow & Grady, 1993).
Australian students, on average, have a lesser sense of belonging than students on average across OECD countries (index score of -0.19 compared to OECD average of 0). The differences between school sectors were apparent, although all were significantly lower than the OECD average. Students at government schools felt this sense of belonging to a lesser extent (index score -0.27) than students either in Catholic or independent schools (index scores for both -0.08).
In particular, 30 per cent of students in government schools and 23 per cent of students in both Catholic and independent schools agreed that I feel like an outsider (or left out of things at school), 27 per cent of students at government schools and 22 per cent of students in both Catholic and independent schools agreed that I feel awkward and out of place at my school, and 21 per cent of students at government schools and 17 per cent of students in both Catholic and independent schools agreed that I feel lonely at school.
Sense of belonging was also measured in 2012, allowing comparisons over time to be made. In all school sectors, the percentage of students agreeing to the positive statements decreased significantly and the percentage agreeing to the negative statements increased significantly.
For all school sectors the largest change was on the item I feel like an outsider (or left out of things at school) (increases of 14 percentage points for government schools, 11 percentage points for Catholic schools, and 10 percentage points for independent schools). Other large changes were an 11 percentage point decline in the percentage of students in government schools that agreed that I feel like I belong in school compared to a decline of 10 percentage points in independent schools and an eight percentage point decline in Catholic schools.
Summary
Clearly, the decline in Australia’s PISA scores is a complex problem, necessitating complex and varied solutions. What is evident from these data, however, is that the decline in scores cannot be attributed to one particular school sector, but it is shared across the whole system.
Also very evident – and remembering that presented here are just three of the many constructs examined in the school, teacher and student questionnaires – is that students are not feeling the way that we as a community would probably prefer they feel, teachers are feeling stressed, and principals are noting the effect of this on their schools’ capacity to provide instruction.
If Australia is to have any hope of improving scores on international assessments then the underlying health of the whole system needs to improve. This is, after all, the aim of participating in these assessments.
References
Berkowitz, R., Moore, H., Astor, R. A., & Benbenishty, R. (2017). A Research Synthesis of the Associations Between Socioeconomic Background, Inequality, School Climate, and Academic Achievement. Review of Educational Research, 87(2), 425–469. https://doi.org/10.3102/0034654316669821
Goodenow, C., & Grady, K. E. (1993). The Relationship of School Belonging and Friends’ Values to Academic Motivation Among Urban Adolescent Students. The Journal of Experimental Education, 62(1), 60–71. https://doi.org/10.1080/00220973.1993.9943831
MacNeil, A. J., Prater, D. L., & Busch, S. (2009). The effects of school culture and climate on student achievement. International Journal of Leadership in Education, 12(1), 73–84. https://doi.org/10.1080/13603120701576241
Thomson, S., De Bortoli, L., Underwood, C., & Schmid, M. (2020). PISA 2018: Reporting Australia’s Results. Volume II Student and School Characteristics. ACER. https://research.acer.edu.au/ozpisa/49/
Way, N., Reddy, R., & Rhodes, J. (2007). Students’ Perceptions of School Climate During the Middle School Years: Associations with Trajectories of Psychological and Behavioral Adjustment. American Journal of Community Psychology, 40(3–4), 194–213. https://doi.org/10.1007/s10464-007-9143-y
[1] Index scores in PISA are constructed by the combination of items that comprise the scale. Indices were standardised to have a mean of 0 and a standard deviation of 1 across OECD countries. In instances where a scale has been used in a previous PISA assessment, the OECD average in PISA 2018 may not have a value of 0. This may be due to the increases in the number of OECD countries and/or the changes in the responses to the items over time. Positive values on the index indicate that the construct is more evident than on average across the OECD, while negative values indicate that the construct is less evident than on average across the OECD.