Student engagement and confidence in reading: PIRLS recap
In my previous column for Teacher, I talked about Australia’s participation in the IEA’s Progress in International Reading Literacy Study (PIRLS).
PIRLS aims to provide the best policy-relevant information about how to improve teaching and learning and to help young students become accomplished and self-sufficient readers, by assisting countries to monitor and evaluate their teaching of reading across time.
It’s important to identify those children who are most at-risk of not being able to read well at this critical stage of their education. At year 4, students are moving from the stage of learning to read, to the stage of reading to learn. If a student is not able to glean what is required from a text, and more and more of their learning as they progress through school is text-based, then this may add an additional challenge to their learning, regardless of the subject.
In particular, as we emerge from the disruptions to schooling over the past several years caused by the COVID-19 pandemic, it is important that we attempt to monitor student engagement in reading – in particular their liking and their confidence, as well as their overall performance. NAPLAN (the national assessment of literacy and numeracy here in Australia) was cancelled in 2020, when the PIRLS 2021 cohort were in year 3 (so they missed this assessment), and the results for NAPLAN 2022 have not yet been released (at the time of writing), so PIRLS 2021 may give us the first indication of how well Australian year 4s have fared over the pandemic.
As well as assessing students’ capabilities in regard to reading, PIRLS also asks a variety of questions aimed at understanding more deeply the links between achievement, attitudes, and beliefs. Considerable research over many years has shown that positive attitudes and achievement are related, and that the influence runs in both directions: attitudes influence achievement and achievement reinforces (or perhaps alters) attitudes. This is likely because better readers enjoy reading more than poorer readers, so they may read more often than poorer readers and thereby develop more advanced comprehension skills and strategies.
The importance of establishing strong positive attitudes towards learning – particularly towards reading, which underlies so much of students’ learning – is critical, particularly in view of the past two years. In many jurisdictions, students’ learning largely took place away from the classroom, and a liking for and confidence in reading may have been beneficial for maintaining and progressing learning amongst students.
PIRLS recognises the important role of student attitudes in reading achievement by collecting responses to two attitude scales – the Students Like Reading scale (a measure of participation and enjoyment of reading), and the Students’ Confidence in Reading (a measure of their self-rated ability in reading).
Enjoyment of reading in 2016
The Students Like Reading scale summarises students’ responses to 8 questions about how often they participate in and how much they enjoy reading. Students were asked to indicate their level of agreement (‘agree a lot’, ‘agree a little’, ‘disagree a little’ or ‘disagree a lot’) with each of the following statements:
- I like talking about what I read with other people
- I would be happy if someone gave me a book as a present
- I think reading is boring (reverse scored)
- I would like to have more time for reading
- I enjoy reading
- I learn a lot from reading
- I like to read things that make me think
- I like it when a book helps me imagine other worlds
Students were also asked how often (‘every day or almost every day’, ‘once or twice a week’, ‘once or twice a month’ or ‘never or almost never’) they did the following activities outside of school time:
- I read for fun
- I read to find out about things I want to learn.
Responses to these two sets of questions were combined to create the Students Like Reading scale. Students who ‘very much like reading’ had a score of at least 10.3 on this scale. This is the point on the scale corresponding to ‘agreeing a lot’ with 4 of the 8 statements and ‘agreeing a little’ with the other 4, as well as reporting that they read for fun and read things they choose themselves ‘every day or almost every day’, on average. Students who ‘do not like reading’ had scores no higher than 8.3. This is the scale point corresponding to ‘disagreeing a little’ with 4 of the 8 statements and ‘agreeing a little’ with the other 4, as well as reporting that they read for fun and read things they choose themselves only ‘once or twice a month’, on average. All other students were assigned to the ‘somewhat like reading’ category.
Interestingly, given previous research, the correlation between liking reading and achievement on PIRLS is not strong in Australia, indicating that some students performed well on the PIRLS scale, but reported not liking reading, and, conversely, some students who said they very much liked reading, but did not perform well on PIRLS. However, in general, students who reported that they liked reading scored substantially better on the PIRLS assessment.
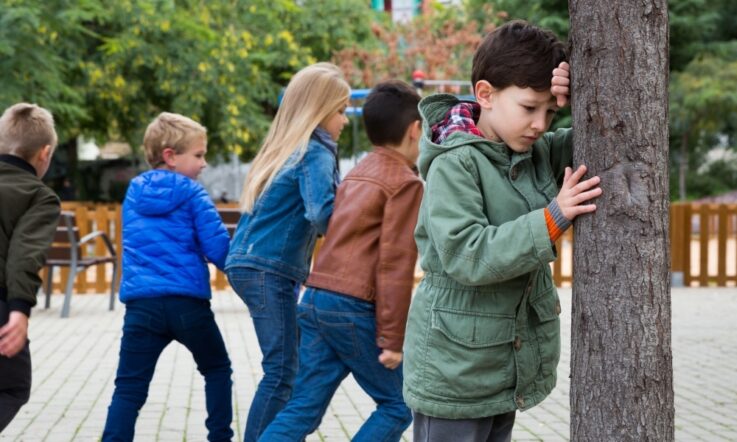
Across all Australian students, 43% of students responded in a manner that indicated that they very much like reading, but this is quite skewed by gender. Figure 1 shows the percentages of male and female Australian students in each of the categories, and their average score in PIRLS 2016. A real concern is that one in five Year 4 boys report that they do not like reading.
Figure 1 The 2016 PIRLS Students Like Reading scale and Australian year 4 student achievement in reading, by gender
Confidence in reading in 2016
Students were also asked to indicate their level of agreement (‘agree a lot’, ‘agree a little’, ‘disagree a little’ or ‘disagree a lot’) with each of the following 6 statements:
- I usually do well in reading
- Reading is easy for me
- I have trouble reading stories with difficult words (reverse scored)
- Reading is harder for me than for many of my classmates (reverse scored)
- Reading is harder for me than any other subject (reverse scored)
- I am just not good at reading (reverse scored).
Responses to these items were combined to create the Student Confidence in Reading scale. Students who were categorised as ‘very confident in reading’ had a score of at least 10.3 on this scale, which is the point that corresponded to ‘agreeing a lot’ with the first 3 of the six statements and ‘agreeing a little’ with the other 3, on average. Students who were ‘not confident in reading’ had scores no higher than 8.2, which is the scale point corresponding to ‘disagreeing a little’ with the first 3 of the six statements and ‘agreeing a little’ with the other 3, on average. All other students were categorised as ‘somewhat confident in reading’.
As may be expected, students who were very confident in reading scored higher, on average, in the PIRLS 2016 reading assessment than did students who were somewhat confident in reading. Students who were not confident in reading scored significantly lower, on average, than other students (see Figure 2).
Figure 2 The PIRLS 2016 Student Confidence in Reading scale and Australian year 4 student achievement in reading, by gender
PIRLS 2021 results
On 13 December, the results for PIRLS 2021 will be released for Australia. The reporting will be different than in previous cycles (2011, 2016), when a comprehensive report was published at the same time as the international report.
Because of COVID interruptions, a reduced number of countries were able to run their PIRLS 2021 assessment as originally scheduled – this group of countries are referred to as Wave 1 countries and includes Australia. Others completed the test when their student cohort had begun the next academic year (Wave 2 countries). These differences in timing in the academic year and average age of students raises questions about the comparability of results between countries in Wave 1 and Wave 2.
When comparing Australia’s results with those of other participating countries, the focus is usually on countries that are either top-performers, test in English and/or have education systems similar to Australia’s (usually for historical reasons). Countries that tested in English and are in Wave 1 for 2021 include Hong Kong, Singapore and New Zealand. The United States, England and Northern Ireland, along with some provinces in Canada, are in Wave 2, and so their results for PIRLS 2021 will not be compared to those for Australia.