
Australia appears to have put the brakes on a long-term decline in student performance levels, according to the latest PISA international test results. However, its top 10 position globally is mainly due to other countries falling lower, and large proportions of students are still failing to meet the National Proficient Standard.
The OECD PISA (Programme for International Student Assessment) test measures the ability of 15-year-old students to apply their knowledge and skills in reading, mathematical, and scientific literacy.
The 2022 results, released today, show Singapore once again topped the tables across the board, with its students performing significantly higher than their international counterparts in all 3 domains.
A report by the Australian Council for Educational Research (ACER), which manages PISA in Australia, shows that despite the pandemic Australian students’ performance has remained steady since the previous PISA cycle, while the average score across OECD countries has fallen significantly for mathematics and reading (De Bortoli et al., 2023a). It is the second cycle of PISA in which Australia’s performance in mathematics and reading has been largely unchanged (covering from 2015 to 2018, and 2018 to 2022), with results in science similar to those in 2018, suggesting an end to the country’s steady decline in results since the large-scale comparative assessment began.
‘While it’s encouraging that Australia’s results have stabilised, it’s important to recognise that our position in the top 10 is largely due to the performance of other countries dropping below ours,’ ACER Senior Research Fellow and report co-author Lisa De Bortoli says.
‘Just over half of Australian students achieved the National Proficient Standard – 51% in maths, 58% in science and 57% in reading – so a significant number of students are failing to demonstrate they have more than basic skills in those areas. The fact that Australia’s performance is largely unchanged since 2015 may be good news in the context of the 2022 results, but it’s not the time for complacency.’
ACER Chief Executive Professor Geoff Masters AO, who this year published a study of 5 school systems that have performed highly in PISA, says a significant commitment to reform is required to lift student performance in Australia.
‘Many top-performing school systems – such as Estonia and Korea – have focused their improvement efforts on transforming the frameworks within which teachers and schools work,’ he says. ‘Their approach to teaching and learning gives greater priority to the development of deeper conceptual understanding and students’ abilities to apply what they learn across different contexts.’
PISA has taken place every 3 years since 2000. The 2021 test cycle, which was delayed by a year because of the pandemic, involved nearly 700,000 students from 81 OECD member and partner economies. In Australia, a representative sample of 13,347 students from 743 schools participated. Each cycle of PISA has a nominated major domain – in 2022 it was mathematics.
International overview
Singapore had a mean score of 575 points in mathematics (up 6 points on its 2018 performance), 561 in science (up 10 points) and 543 in reading (down 7 points), compared to Australia’s respective scores of 487 (down 4 points), 507 (up 4 points) and 498 (down 5 points). Others that outperformed Australia on all domains included Japan, Korea, Estonia, Canada, Macao (China), and Chinese Taipei.
However, out of 62 countries that performed above the lowest-performing OECD country, 38 showed a decline in students’ mathematical literacy between 2018 and 2022 – including the top performing countries of Macao (China), Hong Kong (China), Estonia and Canada.
Writing in the PISA international report (OECD, 2023a), OECD Secretary-General Mathias Cormann said the 2022 assessment had seen ‘an unprecedented drop in performance’ across participating countries and economies. ‘Compared to 2018, mean [OECD] performance fell by 10 score points in reading and by almost 15 score points in mathematics, which is equivalent to three-quarters of a year's worth of learning.
‘The decline in mathematics performance is 3 times greater than any previous consecutive change. In fact, one in 4 15-year-olds is now considered a low performer in mathematics, reading, and science on average across OECD countries. This means they can struggle to do tasks such as use basic algorithms or interpret simple texts. This trend is more pronounced in 18 countries and economies, where more than 60% of 15-year-olds are falling behind.’
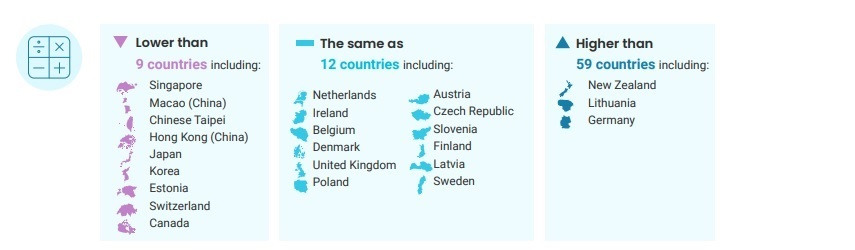
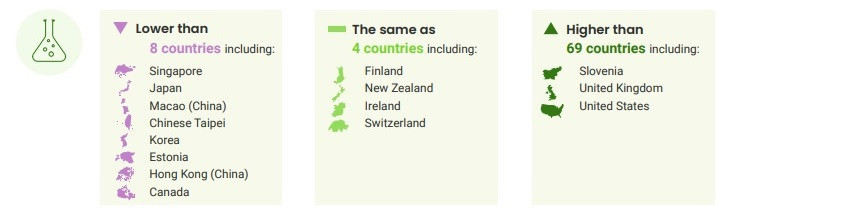
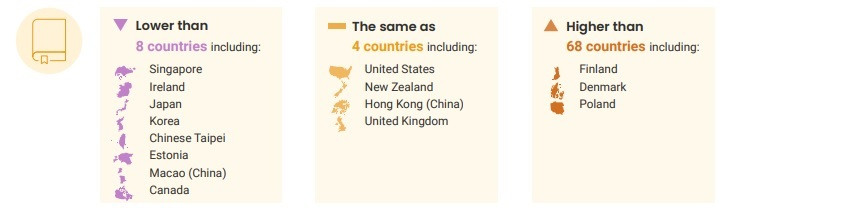
Australia’s 2022 results in each domain
Mathematical literacy
Scientific literacy
Reading literacy
[All images from De Bortoli et al., 2023a)
How Australia performed in 2022
By state and territory
In maths, students in the Australian Capital Territory performed at a similar level to students in Western Australia, New South Wales and Victoria, and at a higher level than students in all other jurisdictions. The mean score in the ACT was 498 points, compared to the OECD average of 472. The proportion of students who attained the National Proficient Standard ranged from 42% in Tasmania to 57% in the ACT.
In science, students in the ACT performed at a similar level to students in WA, and at a higher level than students in all other jurisdictions. The mean score in the ACT was 523 points, compared to the OECD average of 485. The proportion of students who attained the National Proficient Standard ranged from 51% in Tasmania to 66% in the ACT.
In reading, students in the ACT performed at a higher level than students in any other jurisdiction. The mean score in the ACT was 517 points, compared to the OECD average of 476. The proportion of students who attained the National Proficient Standard ranged from 51% in Tasmania to 66% in the ACT.
By school sector
On average, students in the independent school sector performed higher than students in Catholic schools and government schools, and students in Catholic schools performed higher than students in government schools.
Irrespective of the assessment domain, when student-level socioeconomic background was accounted for, students in independent schools still performed at a higher level than students in government and Catholic schools, although the differences were smaller. However, there was no difference in performance between students in government schools and students in Catholic schools.
By gender
Female students performed at a higher level than male students in reading literacy, but they performed at a lower level than male students in mathematical literacy. Female and male students performed at similar levels in scientific literacy.
More female than male students attained the National Proficient Standard in reading literacy, but fewer female students than male students attained the Standard in mathematical literacy. An equal proportion of female and male students attained the National Proficient Standard in scientific literacy.
By geographic location
In all assessment domains, students in major city schools performed at a higher level than students in regional schools, and in turn, students in regional schools performed higher than students in remote schools.
Irrespective of the assessment domain, more students in major city schools attained the National Proficient Standard than students in regional or remote schools. There were more students in regional schools who attained the National Proficient Standard than students in remote schools.
By socioeconomic background
In all assessment domains, students from higher socioeconomic backgrounds performed at a higher level than students from lower socioeconomic backgrounds. The score difference between one quartile and the next was between 28 and 37 points, on average.
In all assessment domains, with each increasing increment in socioeconomic quartile, there were more high performers and fewer low performers. There were also more students who attained the National Proficient Standard with each increasing increment in socioeconomic quartile.
First Nations students
In all assessment domains, First Nations students performed at a lower level than non-First Nations students.
There were fewer First Nations students who attained the National Proficient Standard than non-First Nations students.
Stay tuned: Tomorrow Professor Geoff Masters, CEO of the Australian Council for Educational Research, joins Teacher for a special podcast episode to talk about Australia’s performance, what we could learn from top performer Singapore, and education reforms taking place in other parts of the world.
References and related reading
De Bortoli, L., Underwood, C., & Thomson, S. (2023a). PISA 2022. Reporting Australia’s results. Volume I: Student performance and equity in education. Australian Council for Educational Research. https://doi.org/10.37517/978-1-74286-725-0.
De Bortoli, L., Underwood, C., & Thomson, S. (2023b). PISA in Brief 2022: Student performance and equity in education. Australian Council for Educational Research. https://doi.org/10.37517/978-1-74286-727-4.
OECD. (2023a). PISA 2022 Results (Volume I) The State of Learning and Equity in Education. OECD.
OECD. (2023b). PISA 2022 Results (Volume II) Learning During – and From – Disruption. OECD.
The Australian reports – PISA 2022. Reporting Australia’s results. Volume I: Student performance and equity in education, PISA in Brief 2022: Student performance and equity in education - by Lisa De Bortoli, Catherine Underwood and Sue Thomson, were released to coincide with the launch of the international PISA results by the OECD in Paris. For further information visit www.acer.org/au/pisa