PISA 2025: The first global educational insights
The latest OECD Programme for International Student Assessment (PISA) results have just been released. In his latest Teacher column, OECD Director of Education and Skills Andreas Schleicher shares some of the early data and insights, including the changing landscape of reading performance and translating scientific talent into scientific ambition.
When I talk about the PISA test, I should say that right from the beginning, from the late 1990s, ACER has been one of the intellectual driving forces for the design, development and implementation of PISA, which has now become a kind of global yardstick for measuring educational outcomes – measuring what students know and what they can do on a global scale. Over 700,000 students from 91 education systems took part in this latest edition, all sampled such that they accurately represent 15-year-olds in that country.
Collecting these kinds of data is always a huge effort for countries, but no country can improve just by looking at itself. PISA creates important mirrors and windows. Mirrors in which countries can see themselves, their strengths and weaknesses, and windows where they can see what's possible; what do the most advanced education systems show us can be achieved?
A world of differences in science learning
So, what does the global map of educational performance actually look like? Let's start with science, which was the focus of this latest round of PISA.
The 4 participating jurisdictions of mainland China – Beijing, Shanghai, Jiangsu and Zhejian – they come out on top, more than 100 PISA points above the OECD average. And to give you a sense, 20 points are roughly equivalent to one year of schooling. And the other 4 of the top 5 – Singapore, Macau, Chinese Taipei and Japan, they're all from East Asia too. You have to travel quite a long way down the results before you see the first non-Asian country – Estonia. Then come Korea, the UK, Canada, New Zealand, Australia, Finland, the US, Switzerland, Ireland, and so on.
When you look at the results more closely, you can see something intriguing. The world is no longer divided between rich and well-educated countries, and poor and badly educated ones. In fact, GDP per capita explains just half of the differences – the other half is about policies, about practice. Today, some of the most remarkable educational progress is happening in places that have very few resources, but they use their resources really well.
For example, Cambodia. In 2022, just 4 years ago, Cambodia was at the very bottom of the science scale. Since then, it has improved its PISA performance by 34 points, and if you go back to 2017, the improvement is more than 50 points. That's equivalent to 2 years of schooling – that's not statistical noise, that's a system on the move. Cambodia has begun the kind of educational transformation that once propelled economies such as Korea, Singapore, and more recently China and Vietnam, on a path of rising prosperity. And there is actually a good list of countries that have seen improvements, some very significant, over the last decade.
The global talent pool of top performers
Averages also hide a lot of variabilities within countries. If you want to know who drives tomorrow's scientific advancements, it's worth having a look at students at the top end of the performance distribution – at PISA levels 5 and 6. These students can wrestle with complex scientific concepts, they can evaluate evidence, they can spot flaws in scientific arguments.
Also, that list is dominated by education systems in the Asia Pacific region. But then something interesting happens. In 8th place, you see the United States. The United States was not among the highest performing education systems overall, but it produces a remarkably large share of top performers. The US combines excellence and vulnerability. Because at one end you have that large share of exceptional talent, but at the other end, 22% of American 15-year-olds do not even reach the baseline (level 2) in science.
If you want to understand the global talent pool of top performers, you always need to factor in the size of countries. Beijing, Shanghai, Jiangsu and Zhejian (B-S-J-Z) China represent just a small share of China, but they make the largest contribution (27%) to the global talent pool of PISA’s top performers in science. Actually, overall, just 9 countries account for 80% of the global talent pool of top performers. And what you see here matters, because the geography of talent today shapes the geography of innovation tomorrow.
But here's another twist.
Being brilliant in science doesn't necessarily mean you want to spend your life doing science. In fact, just 55% of those doing well in science want to engage in STEM careers. And some East Asian systems, including big ones like China and Japan, lose ground because many of their high performing students in science are not attracted to STEM. The US moves in the opposite direction – American students are more likely to see science and technology as part of their future. The same is true for Europe. So, we arrive at an interesting puzzle. Why does scientific talent not automatically translate into a scientific ambition? And the answer takes us beyond knowledge and skills.
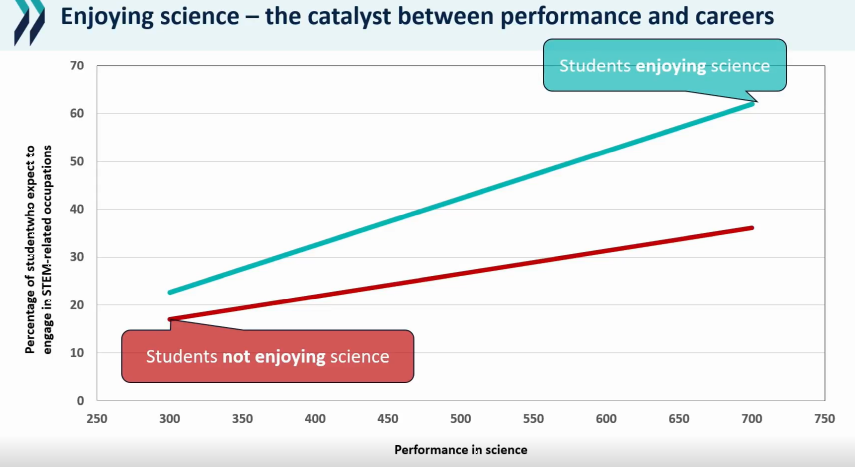
When students perform well in science but do not enjoy science, many never imagine themselves pursuing STEM careers. But when teachers get students to enjoy science, strong performance translates into career aspirations. And perhaps that's a really strong lesson here. If we want more young people to become tomorrow’s scientists, engineers, innovators, it's not enough to teach them physics, chemistry, and biology, but it's important that interest and enjoyment turn that potential into aspiration.
Science to make sense of the world
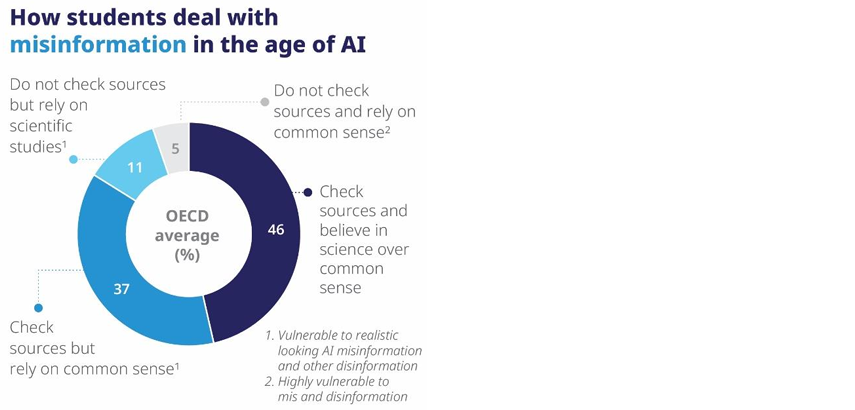
Science is not just for those who become scientists and engineers. Science is something everybody needs today. It's the kind of tool that helps us make sense of the world, build an evidence-based reality, create that kind of scientific optimism that humanity can actually solve some of the world's biggest problems. Science helps us separate signal from noise, fact from opinion. It teaches us to ask: How do we know? Can we trust that claim? And that's something really fundamental in the age of AI.
On average across the OECD, less than 50% of 15-year-olds check sources and also trust in scientific studies as a source to answer their questions. That's half, but not everybody. In fact, you have in many countries a large minority of 15-year-olds – and in some countries actually a majority – who basically say, ‘yeah, maybe I check sources, but when science and common sense collide, I'm going to rely on common sense’. And that is really dangerous in the times in which we live. AI is common sense. AI is very convincing, very compelling, very fluid, very persuasive, but not necessarily true. So, in this age of AI you want young people growing up with a mindset that they check claims, they triangulate sources, they separate signal from noise. Australia is quite well positioned on this, but even there we need to do a lot more beyond physics and chemistry to encourage and develop those scientific ways of thinking.
Looking at the overall trends, in science we have seen a slight dip among OECD countries. In mathematics, that decline has been bigger and in reading it has been really big when you look over the last decade.
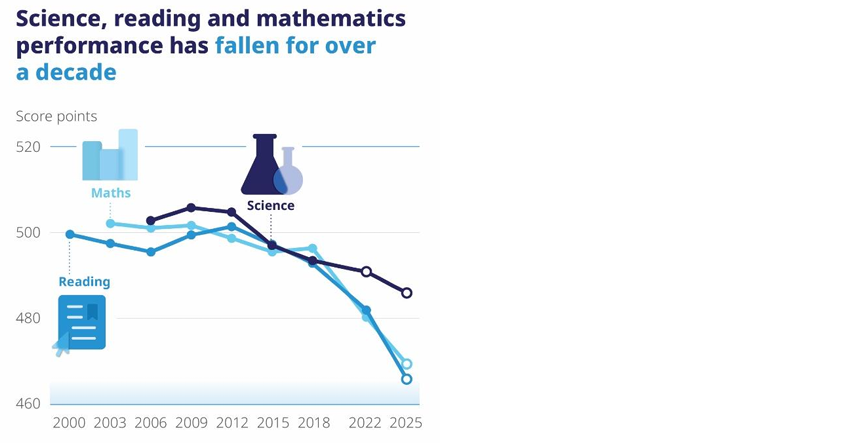
[PISA 2025 Results (Volume 1) © OECD 2026]
The changing landscape of reading performance
Let’s look in a bit more detail into this decline in reading performance. When the last PISA results came out, we thought, ‘wow, that's about COVID’. But if you look at the chart below, it started well before, and it continues down. A much more likely explanation is what you see at the top of the chart.
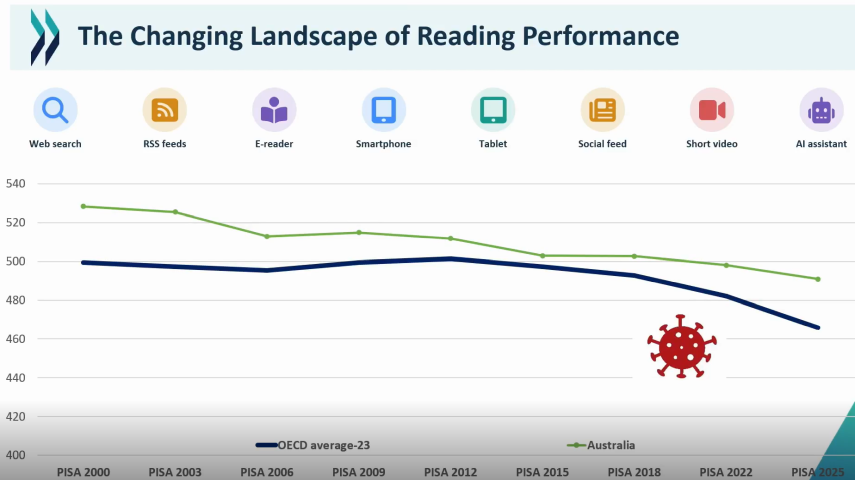
Digitalisation – which has changed the nature of reading, the behavior that is underpinning it. Why do I say that so confidently? Well, it's still a hypothesis. But when we look at the kind of reading tasks that have become much more difficult for students, these are typically higher order thinking tasks – evaluating, reflecting on information, triangulating sources, validating information. What has been less affected are tasks that require students just to look up single pieces of information.
We have also seen that students resort more to hasty reading. They read quickly but not accurately. The share of ‘hasty readers’ has almost doubled since 2018.
And now you think about it, when you read a book, you have to build a complex mental representation of things you do not see in front of you. You have to entertain different characters, how they interact, you have to memorise lots of information, you have triangulate. Those are the kinds of reading skills that we have perhaps better developed in the analogue world and that we actually need now in the AI world. We just process that kind of marmalade that comes out of chatbots without necessarily reflecting as much on this. It's a hypothesis, but something that we should take seriously.
We also see that trends in reading performance have been broadly linked to trends in engagement and curiosity, where students have become less interested, less curious. And where students see less value in school, their reading performance has declined. Those other kinds of changes in behavior and context have been correlated with that trend.
Digital time for learning and leisure
Let’s look in detail at digitalisation. You can see 15-year-olds spend quite a bit of their time on devices now.
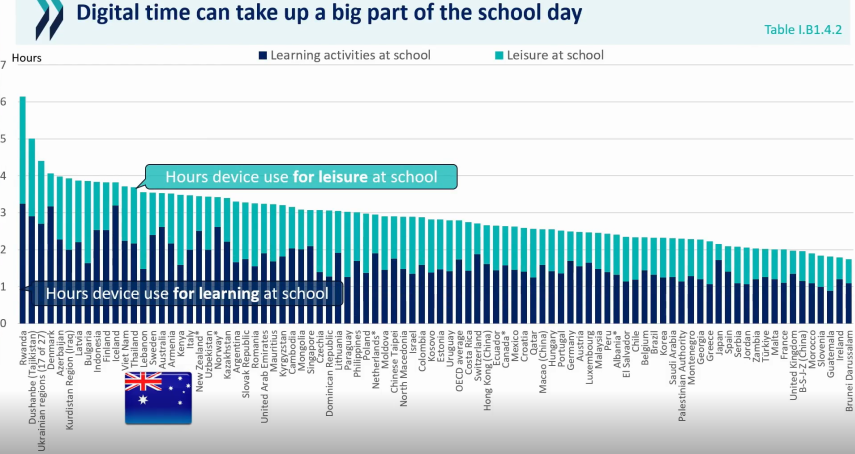
For learning (the dark blue part) that's teacher-directed, often structured. And then for leisure, where students do what they like. It can add up to quite a number of hours. And I make that distinction between digital time for learning and for leisure for a good reason. Because, when you look at patterns with performance, you can see when we use technology for learning, up to a point – up to 3 hours per day – you can say, ‘well, you know, it seems to be doing something, performance improves’ but then comes a tipping point and things slope downwards. And when technology is used for leisure, the picture looks very different. You can see that line slopes dramatically downwards (see Figures 1.4.5 and 1.4.6 in the PISA 2025 Results (Volume I) report).
And, actually, that slope has become steeper between 2022 and 2025. Why?
Again, I can only offer you a hypothesis. One of the things that we have observed is that the use of technology for leisure has moved from creative use to more consumptive use. Today, students spend more time on TikTok, social networks, Instagram, but they spend less time on creating things, generating things. And when you talk with psychologists, with neuroscientists, they'll tell you that's not a healthy direction. What makes your brain develop is the creative use of technology; what makes your brain atrophy is the consumptive use of technology. And perhaps that contributes to this steepening relationship, this increasingly negative relationship between using technology for leisure in school and learning outcomes.
AI as a scaffold or a crutch?
We can see from PISA data that when schools help young people to actually navigate AI, make sure that students know how to validate the information from AI, suddenly you see even daily use is associated with quite good performance. So maybe the combination of AI literacy and AI tools – up to a point – could be conducive for helping students do their schoolwork. There’s a lot more research that needs to go into this, but also, overall, a lot of caution; it’s not so obvious, we cannot simply say that AI is the great accelerator and amplifier of learning.
I think one thing is pretty clear – you do not become fit by watching sports. You become fit by doing sports. And the same holds for AI.
Learning is always about cognitive struggle, about effort. Where AI encourages a struggle, making students question, work harder, think harder, maybe it's a good source for learning. Where AI undercuts that cognitive struggle, it probably undercuts learning. In a way, AI has divorced task performance from learning. It's no longer the case that necessarily doing something will lead to increased learning. That used to be the case, but with AI, that's no longer that obvious. I think we need to think a lot harder to create AI tools now. The biggest design flaw for us as humans is perhaps that our brains were designed to save energy. We always trade in autonomy for convenience. And AI speaks exactly to that. It is making things easier for you but not necessarily making you strong. And I think those kinds of data give us some indications, some insights that are worth further research.
Students learn best from teachers they love
So, after talking about technology, I want to get to the really important thing, and that is teachers. What our PISA 2025 data very clearly show is that there's a very strong relationship between the support that individual students report from their teachers and learning outcomes. Where students feel ‘I have a teacher who knows who I am, who believes in who I want to become, who accompanies me on my journey’, they do a lot better on the academic outcomes, including also some of the social-emotional outcomes.
And the same is true for family support. The PISA data show students who believe that their family consider what they do in school to be important outperform those where that is not the case by a large margin. This impact is far bigger than what we see in terms of family income. It's a really interesting finding. And this is not about families doing homework for 5 hours at the kitchen table with their children – the biggest predictors are all about the signals they give their child: ‘I care about what you do at school’. Those are the signals that are strongly associated with learning outcomes. I say that because, unfortunately, the world, Australia included, have gone in the opposite direction; actually, family support is continuing to fade. In most countries – not all – but in most countries we're losing that.
Beyond academic outcomes
I want to end with a brief look at what's happening beyond the academic outcomes. Remember one of the highest performers in the OECD area, Japan – very strong outcomes in science, in mathematics, but when you look at other things there are some question marks.
Click the links to view an enlarged version of the below Japan and Singapore charts.
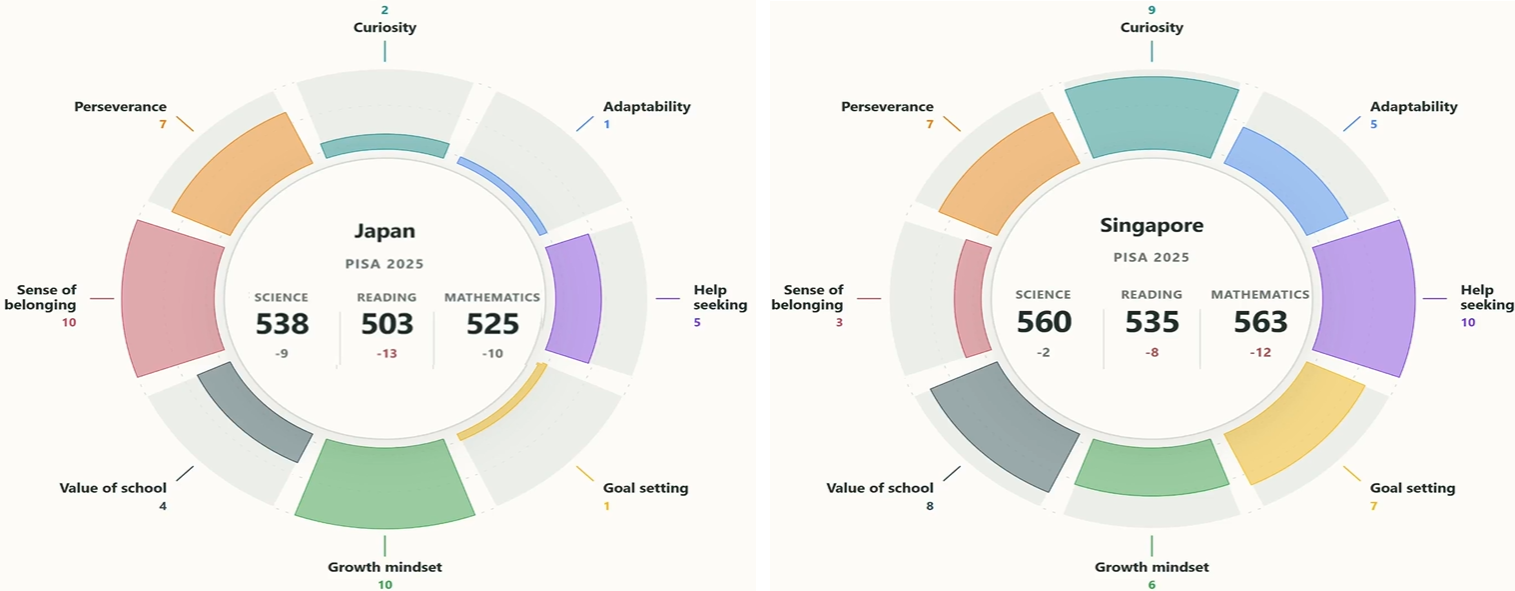
You can say on the positive side, Japanese students have a strong sense of belonging. School is a place where they find identity, where they make friends, all of those kinds of things. Japanese students have a strong growth mindset. They understand that it's investing effort, not the talent they were born with, that is the driver of success. And we know from research that's really important. They persevere, they continue when things get tough – that’s very, very important. But they don't show that much curiosity, that much emotional resilience, that much adaptability. They're not really independent learners – young people who can set their own goals, monitor their own learning progress. So, it's on balance a mixed success.
Compare it with Singapore, another high performer, and you can see they are not so good on sense of belonging, where Japan is strong. They're not so good on growth mindset, where Japan is strong. But they are curious learners, they seek help when they need it, and they know how to manage and take ownership of their own learning. So, you can see 2 countries with similar results can have very, very different types of student characteristics.
Click the links to view enlarged versions of the below Portugal and Poland charts.
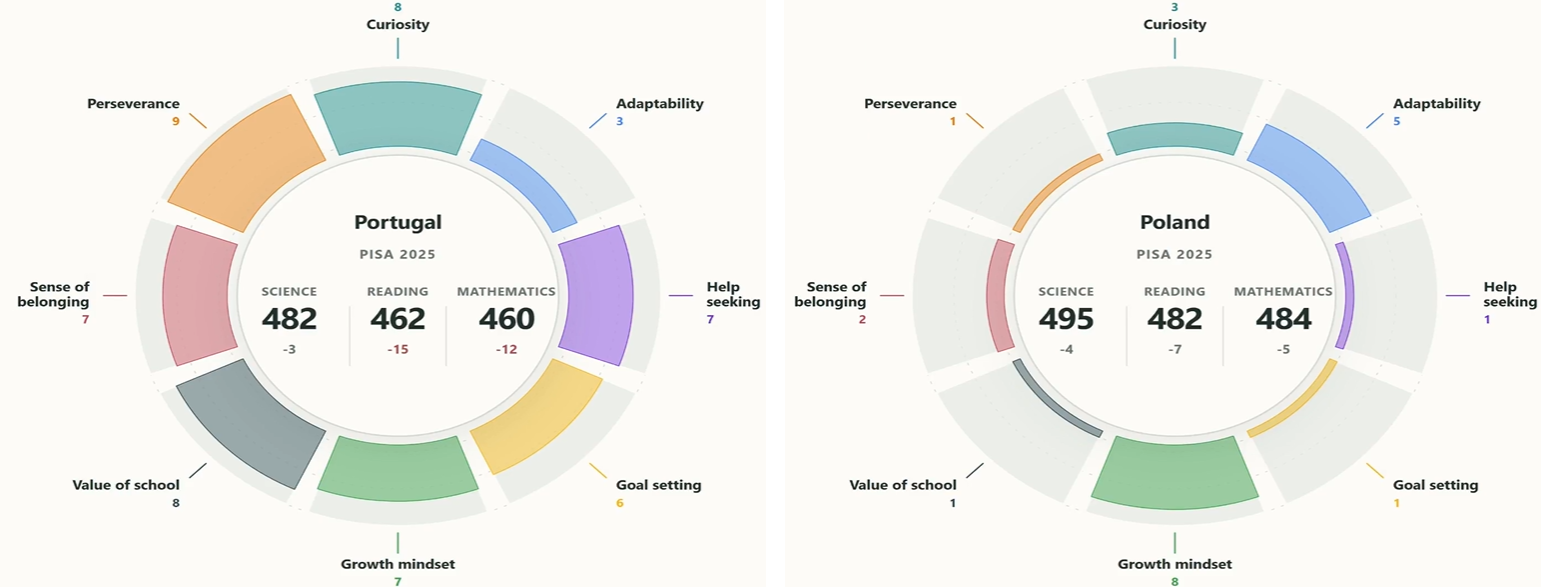
We can look at the same phenomenon at the lower end of the scale. You can look at Portugal. It's sort of a middle range performer, but a pretty good all-rounder. You can see Portuguese students being curious, being perseverant, having a good sense of belonging, seeing value in school, having that growth mindset, being able to manage their learning, seeking help; adaptability maybe not such a great strength, but they’re pretty much an all-rounder. It may not be a very high performing system, but it is a system doing very well.
You take a country like Poland that has almost the same average score as Portugal, but is very thin on the social and emotional outcomes that employers are now equally looking for. It really shows us academic performance doesn't produce those other outcomes as natural byproducts. It takes deliberate effort, intention, and, I believe, good measurement to make those outcomes visible.
Click the links to view enlarged versions of the below Canada, United Kingdom and Australia charts.
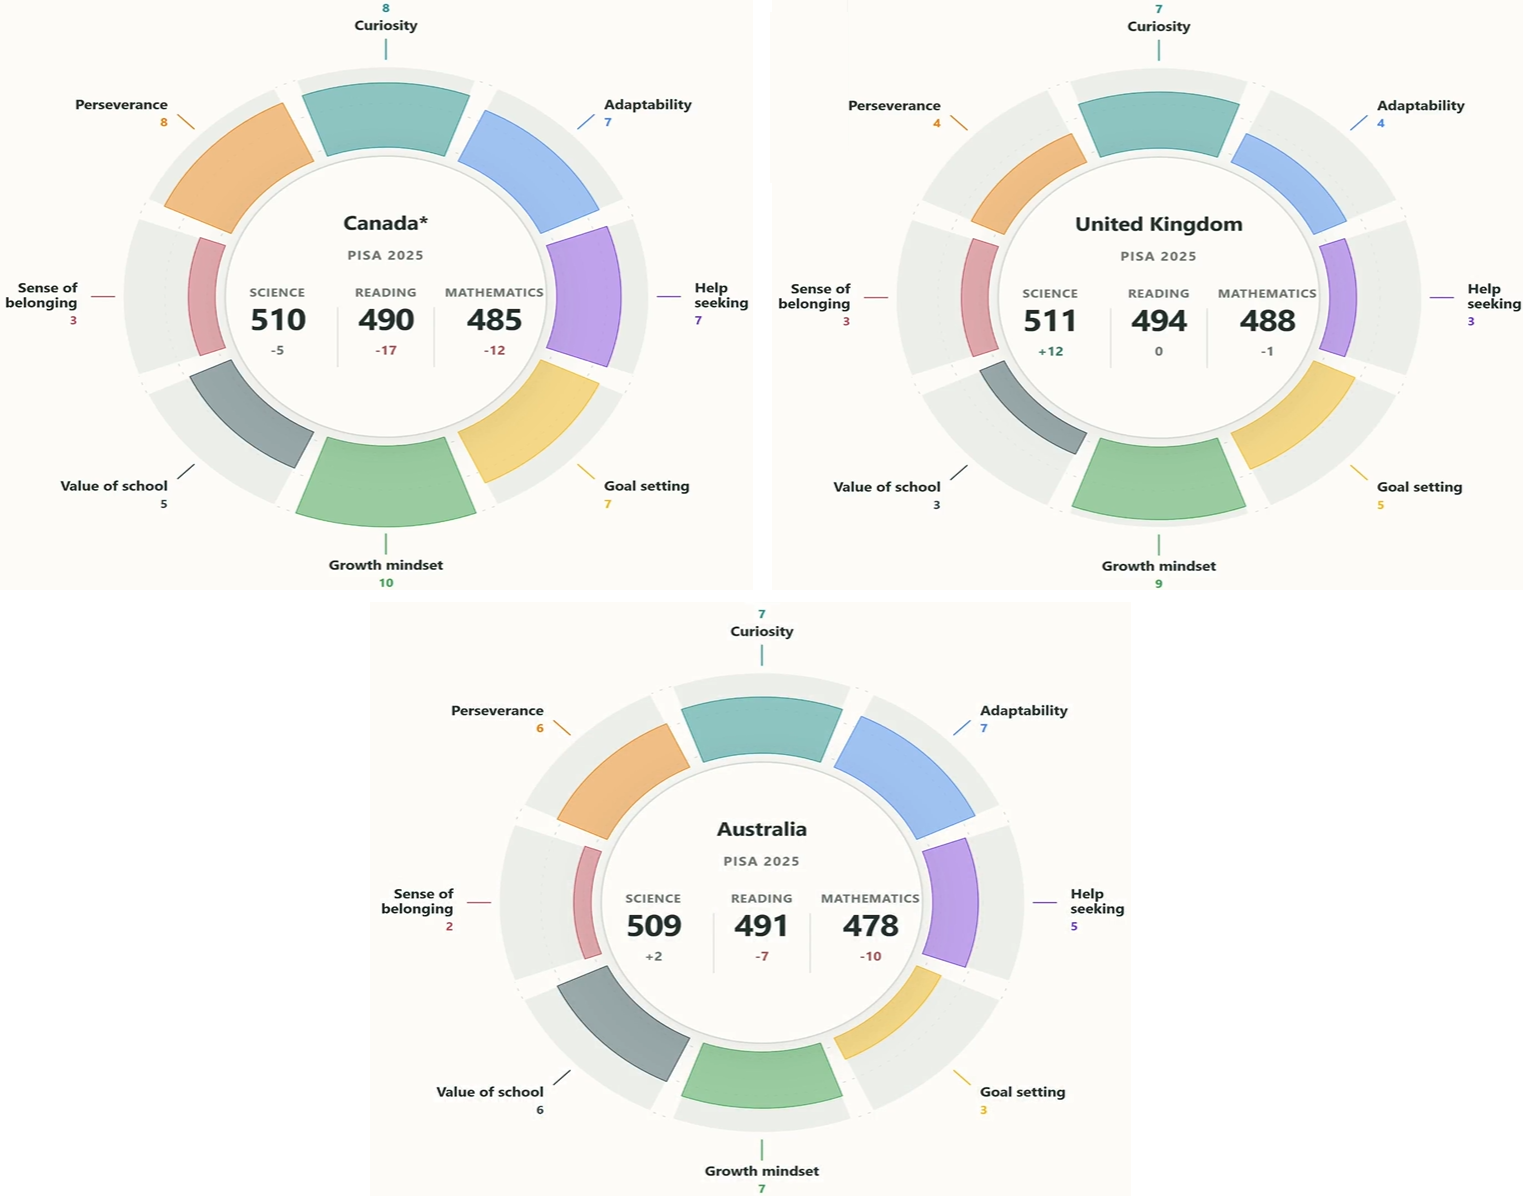
Canada – another really good all-rounder and very strong performance (510 points in science). On all sides, really good, except perhaps that many Canadian students think school is not such a great use of their time, and also their sense of belonging could be a bit better.
Compare Canada with the United Kingdom and you can see a similar average performance, but the UK is much weaker on the social and emotional outcomes like sense of belonging, value of school, perseverance, adaptability, help seeking, even self-related learning. So, again, we need to look at this.
And then last, but not least, we can see Australia – also a country that does quite similar to the UK and Canada. Pretty good on some dimensions, but also other areas to learn.
You can find more on this and other findings, including students’ performance in environmental science and their attitudes towards the environment, and performance in computational problem-solving in Volume 1 of the global PISA results (OECD, 2026).
This Andreas Schleicher column is based on his presentation to the ACER and University of Melbourne symposium Beyond the Results – What PISA 2025 means for education in Australia.
References
OECD. (2026). PISA 2025 Results (Volume I): Future-Ready Students. PISA, OECD Publishing. https://doi.org/10.1787/73451bc5-en