
Australia’s 15-year-old students continue to perform above the OECD average across science, reading, and mathematics, the latest OECD Programme for International Student Assessment (PISA) results show.
PISA is the world’s largest international assessment of student learning, and it shows how well 15-year-old students can apply their knowledge and skills in science, reading and mathematics to real-world situations. In 2025, PISA also assessed an additional domain: Learning in the Digital World.
The 2025 results, released simultaneously around the globe today, show B-S-J-Z (China)* and Singapore topped the tables across the board, with their students performing significantly higher than their international counterparts in all 3 domains.
PISA 2025 involved 760,000 students internationally, representing approximately 33 million students from 91 countries and economies worldwide. In Australia, 14,658 students from 766 schools participated in the assessment, representing approximately 275,000 15-year-old students.
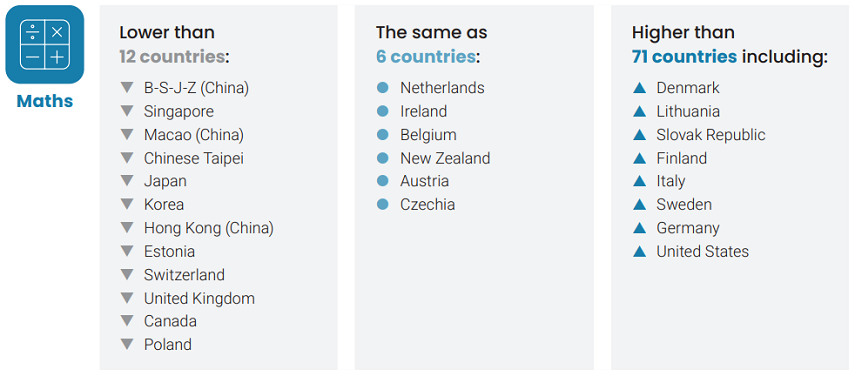
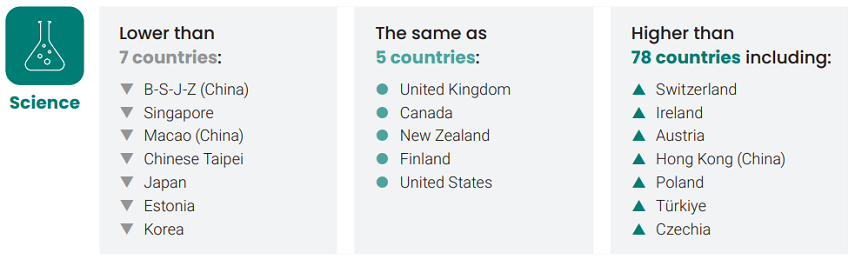
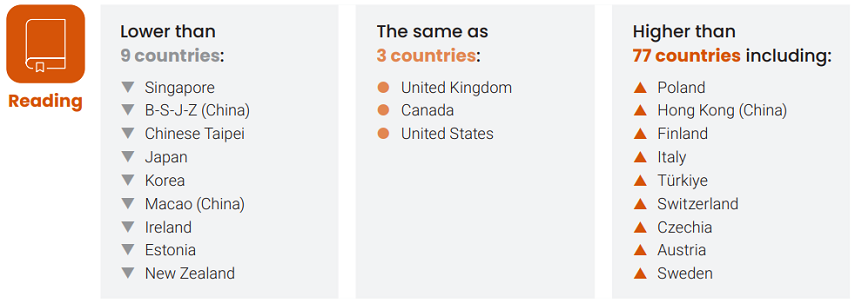
Australia achieved average scores of 509 in science, 491 in reading and 478 in mathematics compared to the OECD average of 482 in science, 461 in reading and 463 in maths. Australia performed significantly higher than 78 countries and economies in science, 77 in reading and 71 in mathematics. Only a small group of education systems performed significantly higher than Australia across all 3 domains – Singapore, B-S-J-Z (China), Macao (China), Chinese Taipei, Japan, Korea and Estonia.
The Australian Council for Educational Research (ACER) is responsible for the design and implementation of PISA globally and it led the transition to a fully digital assessment platform for PISA 2025.
Eveline Gebhardt, Head of Division, Assessment Development, Implementation and Reporting at ACER says that Australia remains a high-performing education system, performing above the OECD average in science, reading, mathematics, and learning in the digital world.
‘While long-term declines remain a challenge, Australia's international standing remains comparatively strong, with students continuing to outperform many of their international peers.’
Those long-term declines have been observed across science, reading and mathematics. Mathematics shows the largest long-term decline (down 46 points from 2003 to 2025) and remains an ongoing area of concern.
Each PISA cycle has 3 domains – science, mathematics and reading. The past 5 testing cycles have also featured an innovative domain. The innovative domain for 2025 was Learning in the Digital World, in which Australian students performed strongly, achieving an average score of 532, well above the OECD average of 500.
‘Australian students continue to achieve above the OECD average in the knowledge and skills essential for future learning, employment, and participation in society,’ Gebhardt says.
International overview
The OECD’s PISA 2025 Results (Volume I) Future‑Ready Students details the international findings.
Writing in the report, OECD Secretary-General Mathias Cormann says, ‘The results reveal an uneven picture. Following the unprecedented drop in performance recorded in PISA 2022, learning outcomes have largely stagnated or continued to decline in many countries.’
In his Foreword, OECD Director for Education and Skills and Teacher columnist Andreas Schleicher says ‘when one country succeeds, it becomes a reference point for others’ and emphasises that rather than being a league table, PISA provides a compass for education improvement.
‘PISA also offers powerful reminders that change is possible. Germany transformed the wake-up call of the 2001 PISA shock into a far-reaching programme of reform. Brazil showed that greater equity and higher quality can advance hand in hand, dramatically expanding educational opportunity while improving PISA outcomes. And Türkiye demonstrated how quickly progress can happen, lifting science performance by almost 70 PISA points in a decade – the equivalent of adding more than three years of learning.’
The 2025 international results show that in science, B-S-J-Z (China) and Singapore were the 2 highest performing countries with mean scores of 597 points and 560 points respectively.
In reading, Singapore and B-S-J-Z (China) were the 2 highest performing countries with mean scores of 535 and 527 points respectively. And in maths, B-S-J-Z (China) and Singapore were the 2 highest performing countries with mean scores of 612 points and 563 points respectively.
Australia’s 2025 results in each domain
Mathematical literacy
Scientific literacy
Reading literacy
[All images from De Bortoli et al., 2026]
Learning in the Digital World
In PISA 2025, Learning in the Digital World measured students’ ability to learn effectively in technology-rich environments. The innovative domain assessed how well students use digital tools to find and evaluate information, solve problems, develop understanding, and improve their learning through reflection and feedback.
Australian students performed strongly, achieving an average score of 532, well above the OECD average of 500. The results suggest Australian students are generally well-equipped to learn, problem-solve and work in digital environments.
More than three-quarters of Australian students (77%) attained the National Proficient Standard in Learning in the Digital World, making it Australia’s strongest-performing PISA domain. In addition, 38% of Australian students were classified as high performers, compared with 26% of students across the OECD.
How Australia performed in PISA 2025
By state and territory
Achievement varied across Australian jurisdictions, although most states and territories performed at or above the OECD average across multiple domains. Students in the ACT recorded the highest results nationally in science (537 points), reading (517 points), mathematics (502 points) and Learning in the Digital World (547 points).
Students in Victoria, Western Australia and New South Wales performed above the OECD average across all reported domains. Their peers in Queensland and South Australia achieved above-average results in science and reading and performed around the OECD average in mathematics.
The Northern Territory and Tasmania recorded the lowest average student scores nationally, although results generally remained around the OECD average across domains.
By school sector
Students in independent schools achieved the strongest outcomes across science, reading and mathematics. On average, they scored around 50 points higher than government school students and approximately 30 points higher than Catholic school students across all 3 domains.
Attainment of the National Proficient Standard was also highest among independent school students, reaching 74% in science, 69% in reading and 65% in mathematics.
By gender
The relationship between achievement and gender differed across science, reading and mathematics. Female and male students performed equally well in science, with both groups achieving an average score of 509 points.
Female students outperformed male students in reading by 32 points. In contrast, male students outperformed female students in mathematics by 17 points.
This difference was also reflected in attainment of the National Proficient Standard in mathematics, with 52% of male students meeting the benchmark compared with 45% of female students.
By geographic location
Students in metropolitan schools continued to outperform students in regional and remote schools across science, reading and mathematics. Students in major city schools scored 24 points higher than regional students in science, 27 points higher in reading and 30 points higher in mathematics.
The gap was even larger when compared with remote schools, with major city students outperforming remote students by between 46 and 51 points across all 3 domains.
These differences were also reflected in attainment of the National Proficient Standard. In mathematics, 52% of students in major city schools met the benchmark, compared with 39% in regional schools and 30% in remote schools. In science, the figures were 63%, 53% and 40%, respectively, while in reading they were 58%, 48% and 36%.
By socioeconomic background
In Australia, student achievement continues to be strongly associated with socio-economic background across science, reading and mathematics. Students in the highest socio-economic quarter outperformed those in the lowest quarter by 80 points in science, 74 points in reading and 83 points in mathematics.
These differences were also reflected in attainment of the National Proficient Standard. In science, 76% of students from the highest socio-economic quarter attained the standard, compared with 44% of students in the lowest quarter. In reading, the figures were 70% and 42%, respectively, while in mathematics they were 66% and 31%.
While the gap between students from the highest and lowest socio-economic quarters has narrowed slightly over time, this was due to lower achievement among higher-performing students rather than improved achievement among lower-performing students.
First Nations students
First Nations students scored 72 points lower in science, 76 points lower in reading and 74 points lower in mathematics than non-First Nations students.
These gaps were also reflected in attainment of the National Proficient Standard. In science, 35% of First Nations students attained the standard compared with 62% of non-First Nations students. In reading, the figures were 31% and 58%, respectively, while in mathematics they were 22% and 51%.
Science results provided an encouraging sign, with First Nations student achievement improving by 16 points between 2022 and 2025.
Digging deeper into the PISA data
The Australian reports – PISA 2025: Reporting Australia’s results. Volume I: Student performance, PISA in Brief Australia 2025: Student performance - by Lisa De Bortoli, Catherine Underwood and Jonas Bertling, were released to coincide with the launch of the international PISA results by the OECD in Paris.
Today, ACER also published PISA 2025: A first look at student and school characteristics which presents a first overview of Australia’s PISA 2025 contextual results. It focuses on selected constructs related to 15-year-old students’ attitudes towards school and their experiences in the classroom and at school. It also provides initial insights into equity in education in Australia from international and national perspectives, and Australian students’ self-reported effort. The forthcoming report Reporting Australia’s results. Volume II: Student and school characteristics will provide a more detailed analysis of Australia’s results and will be published later this year.
Visit www.acer.org/au/pisa to find out more about PISA and access all of the reports.
*B-S-J-Z (China) refers to the 4 municipalities/provinces (Beijing, Shanghai, Jiangsu and Zhejiang) and are not representative of China as a whole country.
Stay tuned: Next week Jonas Bertling, Research Director, Assessment Implementation and Reporting at ACER, joins Teacher for a special podcast episode unpacking the findings in more detail. We’ll also be sharing more insights in a series of infographics.
References and related reading
De Bortoli, L., Underwood, C., & Bertling, J. (2026). PISA 2025: Reporting Australia’s results. Volume I: Student performance. Australian Council for Educational Research. https://doi.org/10.37517/978-1-74286-810-3
De Bortoli, L., & Underwood, C. (2026a). PISA in Brief Australia 2025: Student performance. Australian Council for Educational Research. https://doi.org/10.37517/978-1-74286-811-0
De Bortoli, L., & Underwood, C. (2026b). PISA 2025: A first look at student and school characteristics. Australian Council for Educational Research. https://doi.org/10.37517/978-1-74286-812-7
OECD. (2026). PISA 2025 Results (Volume I): Future-Ready Students. PISA, OECD Publishing. https://doi.org/10.1787/73451bc5-en