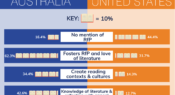
A new study has explored job titles and descriptions for school librarian jobs advertised in the United States and Australia to assess the emphasis placed on a school librarian’s role in promoting reading for pleasure. Researchers found ‘Australian school librarians are far more likely to be expected to foster reading for pleasure’.
More than 900 students aged 13 and above were surveyed about ‘the prevalence of peer-on-peer sexual harassment and sexual violence, including online, in their lives and the lives of their peers’ as part of a rapid review in the UK. Here, we share how boys and girls responded, which shows boys were much less likely to think these things occurred.
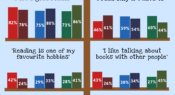
The most recent Programme for International Student Assessment (PISA) survey measured the attitudes held by 15-year-olds on reading. An Australian Council for Educational Research (ACER) Snapshot report has analysed these attitudes, and looked at how they differ between girls and boys, Indigenous and non-Indigenous students, and most disadvantaged and least disadvantaged students.
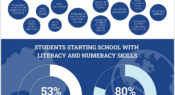
In the Trends in International Mathematics and Science Study (TIMSS) 2019, Year 4 principals were asked to report how many students in their school could do foundational literacy and numeracy skills such as ‘write their names’ and ‘recognise written numbers from 1 to 10’ when they began their first year of primary school. Find out how Australian data compare to the international average in this infographic.
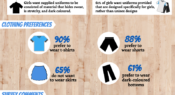
Victoria University surveyed 727 girls aged 12 to 18 to gain insight into their preferences and opinions on sport uniforms. Here, we share what clothing they prefer to wear during school sport and their reasons why. The researchers say findings from the study could enhance school and sport club uniform policy.
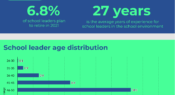
The annual Australian Principal Occupational Health, Safety and Wellbeing Survey collects information on the experiences of school leaders and their state of health and wellbeing. Part of the survey includes collecting demographic data on survey respondents. Here, we look at the age distribution of over 1800 respondents in 2020.
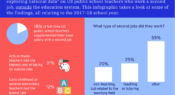
A new paper explores US data on public school teachers working a second job, outside the education system. What proportion of full-time teachers worked a second job? What type of jobs did they take? And, what were their average earnings? Find out in this infographic.
McKinsey surveyed teachers around the world for their views on the effectiveness of remote learning during the COVID-19 school closures. Teachers were asked to reflect on their experiences in the first few months of the pandemic, scoring the effectiveness on a scale of one to 10. Find out the results in today’s infographic.
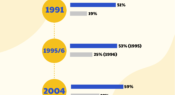
A literature review has looked at the current state of female representation in secondary principal roles in New Zealand. Here, we look at how the percentage of women in secondary principal roles has changed over the past three decades.
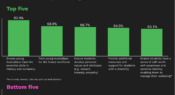
What should and should not be the responsibility of schools? A nationwide poll by the Australian National University asked parents and carers to consider this question in relation to 15 statements. Today’s infographic takes a look at the results.
Facebook
Twitter
YouTube
SoundCloud
Apple Podcasts
Spotify
RSS feed
Linkedin