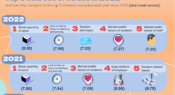
The 12th annual Australian Principal Occupational Health, Safety and Wellbeing Survey shows school leaders are under increasing pressure and stress. Here we share some key insights from the latest (2022) report, and how the top 5 sources of stress for school leaders have evolved over time.
The newly-released Education at a Glance 2022: OECD Indicators reports on the state of education in OECD and partner countries. In this infographic, we take a look at the net statutory teaching time in hours, per year, in public institutions across the world for pre-primary and upper-secondary, general programs.
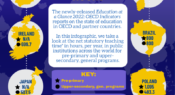
The newly-released Education at a Glance 2022: OECD Indicators reports on the state of education in OECD and partner countries. In this infographic, we take a look at the duration (in years) of initial teacher education for teachers in public institutions around the world.
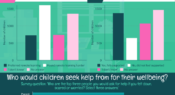
A new report from the Australian Human Rights Commission details the findings of a project exploring children and young people’s experiences of COVID-19. In this infographic, we explore some of the findings related to remote learning, wellbeing support from schools, and where children seek support for their mental health.
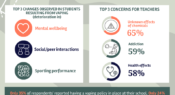
New research assesses the nature and consequences of student vaping in primary and secondary schools in Australia. In this infographic, we explore the responses from a national sample of 196 school staff, surveyed about their perceptions of students’ e-cigarette use.
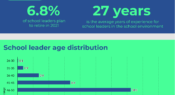
The annual Australian Principal Occupational Health, Safety and Wellbeing Survey collects information on the experiences of school leaders and their state of health and wellbeing. Part of the survey includes collecting demographic data on survey respondents. Here, we look at the age distribution of over 1800 respondents in 2020.
A recent report from the Australian Council for Educational Research explored gender differences in relation to STEM participation, achievement and engagement. Here are some of the results.
Happy World Teachers' Day, Australia. Watch our special video message and pass it on to a colleague.
Facebook
YouTube
SoundCloud
Apple Podcasts
Spotify
RSS feed
Linkedin