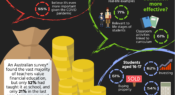
An Australian survey has found that the vast majority of teachers value financial education, but only 52 per cent had taught it at school, and only 21 per cent in the last year. Find out more about their responses and the finance-related topics that students of different ages would like to learn about in today's infographic.
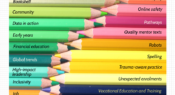
What do you need information on? High-impact school leadership? Data in action? Using quality mentor texts? Online safety? The tenth Teacher alphabet brings you quick links to popular content that you might find useful. Download the PDF for a hyperlinked version.
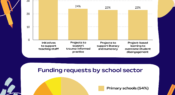
Philanthropic funding is one way school leaders can access support to implement and enhance initiatives and projects. Australian charity Schools Plus recently published details of applications for its latest round of grants. The requests from schools provide a snapshot of the initiatives and projects educators are seeking funding for.
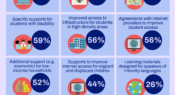
An OECD survey explored how 27 education systems across the globe responded during school closures in 2020. This infographic shows how widely nine different measures were used for at least one level of schooling to target students at risk of exclusion from distance education platforms.
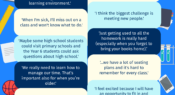
Forums held with students in Years 6, 7 and 8 in Australia on the topic of starting high school have shed light on what concerns them the most about the transition process, and what has been helpful to them along the way. Here, we share some comments from the students.
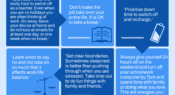
In our annual Teacher magazine reader survey, we ask you to share one piece of advice with a fellow educator. As the school holidays approach, in this infographic, we share some of the responses we received about the importance of switching off from work.
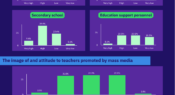
A survey of education officials and union leaders from all levels of education in 94 countries has given insight into how the teacher profession is viewed at a global scale. In this infographic, we share some of the survey responses in relation to K-12 settings.
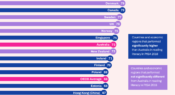
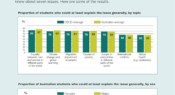
A new issue of Snapshots, from the Australian Council for Education Research (ACER), looks at self-reported levels of effort students invested in the PISA (Programme for International Student Assessment) 2018 test. Today’s infographic looks at the percentage of students in 20 participating countries and economies who indicated they would have invested more effort in the test if it counted towards their school marks.
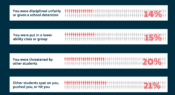
Data collected from Aboriginal and Torres Strait Islander children aged between 10 and 15 years old highlights the prevalence of racism and racial discrimination experienced by young people. Here, we share their responses to seven statements relating to self-reported experiences of direct racial discrimination in a school setting.
The latest edition of Snapshots, from the Australian Council for Educational Research (ACER), digs into PISA 2018 data to explore the question: How aware of global issues are Australian 15-year-olds? Students were asked to report the extent to which they knew about seven issues. Today’s infographic looks at some of the results.
Facebook
YouTube
SoundCloud
Apple Podcasts
Spotify
RSS feed
Linkedin