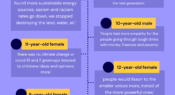
Almost 14,000 children aged 8-12 responded to the prompt, ‘the world would be better if…’ as part of a project run by South Australia’s Commissioner for Children and Young People. In this infographic, we share some of their responses.
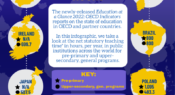
The newly-released Education at a Glance 2022: OECD Indicators reports on the state of education in OECD and partner countries. In this infographic, we take a look at the net statutory teaching time in hours, per year, in public institutions across the world for pre-primary and upper-secondary, general programs.
In our annual Teacher magazine reader survey, we ask you to share one piece of advice with a fellow educator. In this infographic, we share some of the responses we received about reading.
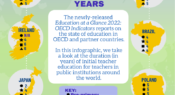
The newly-released Education at a Glance 2022: OECD Indicators reports on the state of education in OECD and partner countries. In this infographic, we take a look at the duration (in years) of initial teacher education for teachers in public institutions around the world.
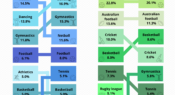
What sports does your school offer? Is there an overlap with the sports and activities students participate in outside school? In this infographic, we compare the data on the top 10 sports for girls and boys aged 0-14 to see how habits have changed over a 5-year period.
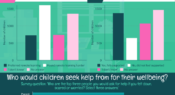
A new report from the Australian Human Rights Commission details the findings of a project exploring children and young people’s experiences of COVID-19. In this infographic, we explore some of the findings related to remote learning, wellbeing support from schools, and where children seek support for their mental health.
A new report has assessed whether copyright limitations for educational purposes are unfit for remote education through a legal analysis of copyright laws in 40 countries. This infographic shows the number of countries in the report for which the following online teaching scenarios are not legal.
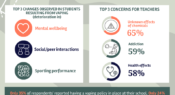
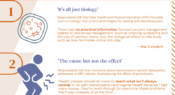
New research assesses the nature and consequences of student vaping in primary and secondary schools in Australia. In this infographic, we explore the responses from a national sample of 196 school staff, surveyed about their perceptions of students’ e-cigarette use.
Findings from a cross-sectional survey looking into young Australian women’s experiences of menstruation and dysmenorrhea indicate the need for better menstrual health education in Australian schools. Find out more about the survey responses in relation to menstrual health in Australian Health and Physical Education in today’s infographic.
Over 8,300 children aged between 8 and 12 answered the question, 'what would make things better for kids in South Australia?' as part of an engagement project by the state’s Commissioner for Children and Young People. Here, we share some of their responses related to school.
Facebook
YouTube
SoundCloud
Apple Podcasts
Spotify
RSS feed
Linkedin