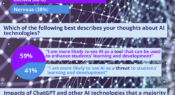
A new report from McCrindle outlines 7 disruptors impacting the future of education, informed by survey data. One identified disruptor is artificial intelligence and technological change. In this infographic, we share some of the survey results for questions on artificial intelligence and technological change.
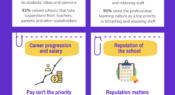
The Australian School Education Leaders Sentiment Index, by Slade Group, explores the priorities and drivers for school leaders when considering a new role. It draws on findings from interviews and a survey with 60 principals, from which 5 key themes emerged. Find out more in our latest infographic.
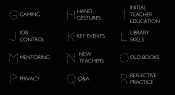
What do you need information on? Behaviour strategies? Embedding First Nations perspectives? Student engagement? Reflective practice? The 11th Teacher alphabet brings you quick links to popular content that you might find useful. Download the PDF for a hyperlinked version.
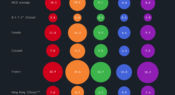
The new country report Education Policy Outlook in Australia has highlighted the fact that 'The disciplinary climate in schools in Australia was among the least favourable in the OECD according to students' reports in PISA 2018'. In this infographic we take a look at those PISA survey statistics, and how Australia compares with 11 other countries.
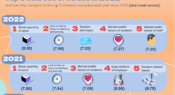
The 12th annual Australian Principal Occupational Health, Safety and Wellbeing Survey shows school leaders are under increasing pressure and stress. Here we share some key insights from the latest (2022) report, and how the top 5 sources of stress for school leaders have evolved over time.
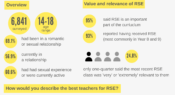
The Australian National Survey of Secondary Students and Sexual Health explores young people’s experiences of sex, relationships, sexual health and school-based Relationships and Sexuality Education. Data from the seventh iteration, involving almost 7,000 participants, have just been released – in this infographic we look at some of the findings.
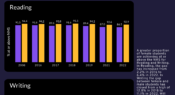
NAPLAN’s National Minimum Standard is the ‘agreed minimum acceptable standard of knowledge and skills without which a student will have difficulty making sufficient progress at school’. Ahead of the 2023 tests, we compare the percentage of male and female students in year 9 achieving at or above the standard in Literacy, over time.
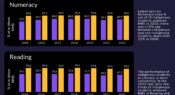
In the National Assessment Program — Literacy and Numeracy (NAPLAN) tests, the national minimum standard (NMS) is the ‘agreed minimum acceptable standard of knowledge and skills without which a student will have difficulty making sufficient progress at school’. This infographic looks at the performance of Indigenous and non-Indigenous students in Year 9, over time.
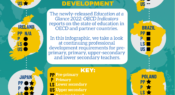
The newly released Education at a Glance 2022: OECD Indicators reports on the state of education in OECD and partner countries. In this infographic, we take a look at professional development requirements for pre-primary, primary, upper-secondary and lower secondary teachers.
In our annual Teacher magazine reader survey, we ask you to share one piece of advice with a fellow educator. In this infographic, we share some of the responses we received on the theme of learning to let go.
Facebook
YouTube
SoundCloud
Apple Podcasts
Spotify
RSS feed
Linkedin