What do you need information on? Strategies for identifying and supporting gifted learners? Digital literacy? Learning Walks and Talks? Indigenous perspectives in maths? The seventh Teacher alphabet brings you quick links to popular content that you might find useful.
The latest Principal Health and Wellbeing Survey reveals 19 sources of stress for school leaders. In this infographic, we look at the top 10 sources of stress reported by school leaders, and their top 5 sources of support.
A new report from the OECD explores the career aspirations of 15-year-olds from across the world. In this infographic, we look at the percentage of boys and girls expecting to work in one of the 10 most commonly cited jobs when they are 30 years old, and how their career choices have changed over time.
Each year in our reader survey, we ask you: ‘looking back on your experience as an educator, if you could share one piece of advice with your peers, what would it be?’ In this infographic, we take a look at some of your responses on the topic of professional development.
Australia’s annual Closing the Gap Report communicates progress towards government targets for Indigenous Australians in areas like education, health and employment. In this infographic, we take a look at results detailed in the 2020 report related to education targets.
The latest cycle of the Teaching and Learning International Survey (TALIS 2018) asked principals in Australia about the time they allocated to various tasks throughout the year, including curriculum-and teaching-related tasks and meetings, administrative tasks and meetings, and student interactions. This infographic takes a look at the results.
Results of a cyber safety survey conducted over three years with respondents from 30 different countries have recently been released. DQ Institute surveyed 145 426 children and adolescents on issues related to cyber safety to assess which countries are considered safest.
A new Health Behaviour in School Aged Children study offers insights into the lives of 11- to 15-year-olds in England. Our latest infographic looks at the proportions of young people who reported not having enough sleep to be able to concentrate on their schoolwork, and how the figures have changed since 2014.
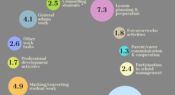
The OECD Teaching and Learning International Survey (TALIS 2018) asked teachers about their working hours. Today’s infographic shows how the weekly workload – including evenings and weekends – for teachers in Australia is split between different tasks.
What advice would you offer to your peers, thinking about your experience as an educator? We put this question to you in our annual reader survey. Today’s infographic looks at some of the responses we received on the topic of collaboration.
Facebook
YouTube
SoundCloud
Apple Podcasts
Spotify
RSS feed
Linkedin