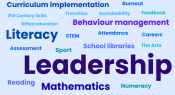
In our latest reader survey, we asked you what you want support on in 2026. You gave us plenty of suggestions, and they will inform our content planning this year. This infographic presents the most popular topic requests we received – the bigger the font, the more popular the request!
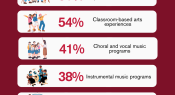
Findings from an Australian Council for Educational Research (ACER) survey commissioned by Alberts and The Tony Foundation of over 700 primary school teachers across 95 schools in New South Wales highlight the different ways music education is being offered. Teachers were asked: ‘In what form(s) is music education provided at your school?’. Find out more in today’s infographic.
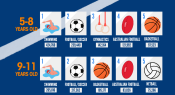
What sports options are on offer at your school for 2026? Today’s infographic might serve up some inspiration. It outlines the most popular organised sports participated in outside of school hours, by age group. The data show activities such as gymnastics and swimming lessons are popular at a younger age, and participation in team sports becomes more popular in older age groups.
The IEA’s Trends in International Mathematics and Science Study (TIMSS) is a global assessment measuring student achievement in years 4 and 8. Teachers from participating schools also complete a questionnaire. Today’s infographic looks at the topics that mathematics teachers reported needing professional development on in the future.
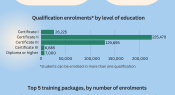
Vocational education and training (VET) in Schools help students gain qualifications and plan for future careers. New data show student participation numbers for VET in Schools has reached its highest level in 2024 since collection began in 2006. Find out more in this infographic.
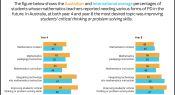
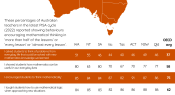
Each cycle of the global Programme for International Student Assessment (PISA) includes a teacher questionnaire. One questionnaire topic – encouraging mathematical thinking – can help foster critical thinking, enhance problem-solving skills and allow students to see the relevance and connectedness of mathematics in their lives.
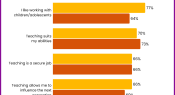
Intrinsic motivation to teach is an important aspect of teacher retention. The latest Teaching and Learning International Survey (TALIS 2024) gathered data about teachers’ motivations by asking them about factors of high importance for working in the profession. Here are the top 5 motivating factors for Australian TALIS participants.
A survey of 115,000 children and young people aged 5-18 from across the UK asked what, if anything, would make them want to write in their free time by giving them a list of 11 suggestions. The results offer insights into possible strategies for your own students.
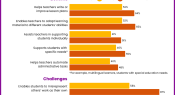
The Teaching and Learning International Survey (TALIS) captures the knowledge and experiences of school educators. Artificial intelligence (AI) featured as survey topic for the first time in 2024. This infographic shows the percentage of Australian teachers who ‘agreed’ or ‘strongly agreed’ with the following benefits and challenges of using AI tools in education.
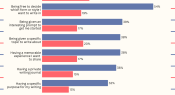
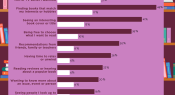
A survey of over 115,000 students in the UK found that over 71,000 only enjoy reading ‘a bit’ or ‘not at all’ in their free time. To understand more about what could make them want to read, these respondents were asked to choose as many options as they liked from a list of 13 suggestions. The results presented in this infographic offer insights into possible strategies for your own students.
Facebook
YouTube
SoundCloud
Apple Podcasts
Spotify
RSS feed
Linkedin