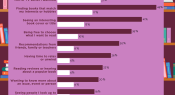
A survey of over 115,000 students in the UK found that over 71,000 only enjoy reading ‘a bit’ or ‘not at all’ in their free time. To understand more about what could make them want to read, these respondents were asked to choose as many options as they liked from a list of 13 suggestions. The results presented in this infographic offer insights into possible strategies for your own students.
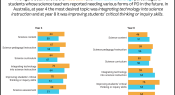
The IEA’s Trends in International Mathematics and Science Study (TIMSS) is a global assessment measuring student achievement in years 4 and 8. Teachers from participating schools also complete a questionnaire. Today’s infographic looks at the topics that science teachers reported needing professional development on in the future.
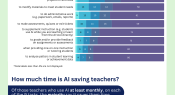
The Walton Family Foundation partnered with Gallup to find out how US teachers are using AI tools in the classroom and the potential for it to save time. Over 2,200 K-12 teachers responded to a survey in April 2025. Here’s a snapshot of some of the findings on how frequently teachers use AI for 9 different tasks, and how many save time by doing so.
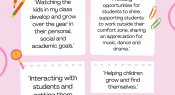
What do you love about teaching? In the Teacher magazine annual reader survey, we asked you what you love about your role. Here, we share some responses we received from primary school educators.
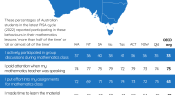
Each cycle of the global Programme for International Student Assessment (PISA) includes a student questionnaire. One questionnaire topic – effort and persistence in mathematics – is essential for students’ success and skill development. The data provide useful prompts for teachers when considering their own students.
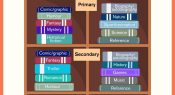
To encourage students to read, it’s important they have access to books that appeal to their interests. This infographic shares the most popular fiction and non-fiction genres of ebooks borrowed by students in primary, secondary and upper secondary.
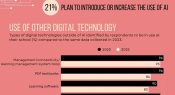
A new report presents 2025 survey data from 104 senior staff in Australian schools about their school’s use of digital technology. The findings show that most schools are using AI tools and that the use of other digital technology has changed since 2023.
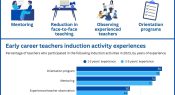
The latest edition of National Trends: Teacher Workforce published by AITSL presents data on the characteristics of the teacher workforce to contribute to an understanding of who Australia’s teachers are and what their workforce experiences look like. In 2023 there were over 50,000 participants in the survey. This infographic shows the induction experience of early career teachers in 2023.
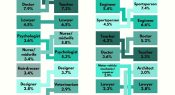
A new report from the OECD draws on PISA 2022 data to reveal the top 10 most popular expected occupations of 15-year-old girls and boys from around the world and compares these new results to the data from PISA 2000. Here, we share how career expectations have changed over the last 22 years for girls and boys.
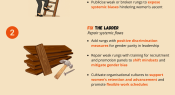
UNESCO’s 2024/25 Global Education Monitoring Report on leadership education includes a gender edition, exploring the gender gaps in school management, education administration and political leadership positions around the world, and the obstacles women face when climbing the leadership ladder in education. It proposes 3 sets of integrated recommendations.
Facebook
YouTube
SoundCloud
Apple Podcasts
Spotify
RSS feed
Linkedin