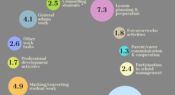
The OECD Teaching and Learning International Survey (TALIS 2018) asked teachers about their working hours. Today’s infographic shows how the weekly workload – including evenings and weekends – for teachers in Australia is split between different tasks.
What advice would you offer to your peers, thinking about your experience as an educator? We put this question to you in our annual reader survey. Today’s infographic looks at some of the responses we received on the topic of collaboration.
The latest OECD Teaching and Learning International Survey (TALIS 2018) asked principals about safety at their school, including incidents of bullying and cyberbullying, intimidation or verbal abuse of teachers and staff, and violence among students. Today’s infographic compares results from Australia to six other countries and global averages.
The OECD's Programme for International Student Assessment (PISA) measures how well 15-year-olds are prepared to use their skills and knowledge to meet real-life challenges. The 2018 data show Australian student performance in all three assessment domains is in long-term decline. This infographic looks at the low and high performers by jurisdiction.
Results from the OECD's 2018 Programme for International Student Assessment (PISA) have been released. The data show Australian student performance is in long-term decline. Today’s infographic looks at Australia’s PISA performance over time, and how the 2018 results compare internationally.
Advocacy group Children and Young People with Disability Australia sought the views of almost 500 parents and carers of primary and secondary students with disability for its 2019 National Education Survey. Today’s infographic looks at some of the main findings.
Two new UK surveys shine a light on how many secondary school students have used a private tutor outside school, and how many primary and secondary teachers have carried out tutoring in their own time.
Each year in our reader survey, we ask you: ‘looking back on your experience as an educator, if you could share one piece of advice with your peers, what would it be?’ In this infographic, we take a look at some of your responses on the topic of lifelong learning.
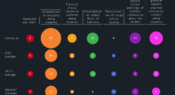
The latest cycle of the OECD’s Teaching and Learning International Survey (TALIS 2018) asked educators around the world about teaching practices they use that are related to equity and diversity.
As a classroom teacher, how often do you explain what you expect students to learn, or how old and new topics are related? The latest OECD Teaching and Learning International Survey (TALIS 2018), asked participants about their use of a range of teaching practices associated with clarity of instruction. Today’s infographic takes a look at the results.
Facebook
YouTube
SoundCloud
Apple Podcasts
Spotify
RSS feed
Linkedin