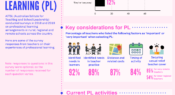
AITSL conducted surveys in 2018 and 2019 on the current arrangements of professional learning in rural, regional and remote schools across the country. Here, we look at some of the survey responses from teachers on their experiences.
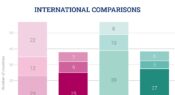
Trends in International Mathematics and Science Study (TIMSS) measures how well Year 4 and Year 8 students from around the world are performing in science and mathematics. In this infographic we look at Australian student achievement over time.
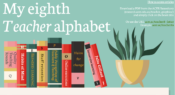
What do you need information on? Strategies for implementing school improvement? Resources for building cultural responsiveness? Ideas for online excursions? The eighth Teacher alphabet brings you quick links to popular content that you might find useful.
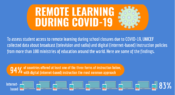
To assess student access to remote learning during school closures due to COVID-19, UNICEF collected data about broadcast (television and radio) and digital (internet-based) instruction policies from more than 100 ministries of education around the world. Today’s infographic shares some of the findings.
Annual data on school students in Australia undertaking vocational education and training (VET) as part of their Senior Secondary Certificate of Education has been released by NCVER. Today’s infographic looks at the headline figures, qualification levels and the most popular training packages for 2019.
Researchers from Monash University surveyed teachers and members of the public in Australia about public perceptions of the teaching profession. Today’s infographic takes a look at the responses on the topic of appreciation.
Children aged 8-14 in Australia recently submitted a 100 word story responding to the prompt ‘A different world – living in lockdown’ for a story-writing event. Their word choices were analysed and in this infographic, we see how their word choices compare to previous instalments of the event.
The sixth annual Teacher survey goes live next week. Each year, we ask readers to share a piece of advice. In today’s infographic we share some of the responses we’ve received on teaching and leading. What would your piece of advice be?
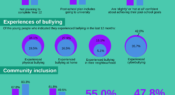
A recent survey conducted by Mission Australia highlights how the experiences of young people with a disability differ to young people living without disability. Topics included inclusion, issues of personal concern and post-school plans. Here, we look at how some of their responses compare.
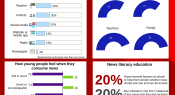
A survey of young Australians has illustrated how young people access, perceive and are affected by news media. Here, we look at some of the key findings from the survey, which was conducted following the bushfire crisis and at the beginning of the COVID-19 pandemic.
Facebook
YouTube
SoundCloud
Apple Podcasts
Spotify
RSS feed
Linkedin