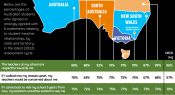
One of the topics in the Programme for International Student Assessment (PISA) student questionnaire is the quality of student-teacher relationships. This infographic looks at the responses of Australian students in the 2022 test cycle, by state and territory.
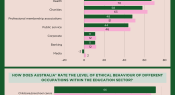
The annual Ethics Index by the Governance Institute of Australia measures the population’s overall view of how ethical the behaviour of major sectors is. The education sector continues to be perceived as the most ethical sector. Here, we see 2024 results for all 8 sectors, specific occupations within education, and how public perceptions have changed from 2023.
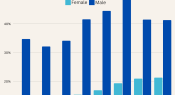
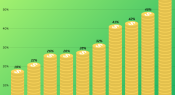
Thinking about your own school context, is there a gender imbalance in STEM-related subjects? How do you encourage girls to consider taking STEM subjects? In this infographic, we look at gender inequality in students entering tertiary education in a STEM field.
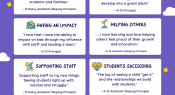
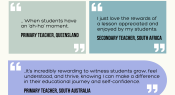
In our latest annual reader survey, we asked you what you love about your role. In our final infographic for 2024, we share some of the responses we received from school leaders.
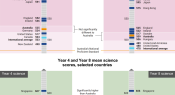
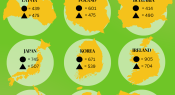
Results from the latest cycle of the Trends in International Mathematics and Science Study (TIMSS 2023) have just been released. Today’s infographic looks at the year 4 and year 8 mean scores in mathematics and science for students in Australia and selected participating countries.
How many hours do you spend teaching each year? How do you think it compares to your peers in Poland, Korea, or New Zealand? In today’s infographic, we share the annual teaching hours of primary and upper secondary teachers in Australia and around the world.
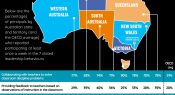
The OECD’s Programme for International Student Assessment (PISA) includes a principal questionnaire. Today’s infographic looks at the percentages of principals by Australian state and territory (and the OECD average) who reported participating at least once a week in 7 stated educational and instructional leadership behaviours.
According to PISA 2022, despite the majority of 15-year-old students already being consumers of financial products and services, many still lack the skills and knowledge needed to make sound financial decisions. In this infographic we look at the financial terms students are learning in school.
Today is World Teachers' Day in Australia. The annual day is celebrated throughout October across the globe. In our latest annual reader survey, we asked you to tell us what you love about your role, and in this infographic, we share some responses from our readers around the world.
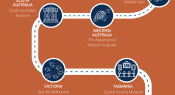
When you’re planning a unit of work for your students, there may be opportunities to include a local trip to support the learning outcomes. Recent research from ACER shows the most popular local learning destinations in Australia and New Zealand for some schools participating in Children’s University, a program designed to engage students aged 5-18 in out-of-school learning enrichment activities.
Facebook
YouTube
SoundCloud
Apple Podcasts
Spotify
RSS feed
Linkedin