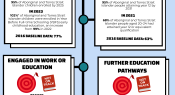
Australia's latest Closing the Gap Report communicates progress towards government targets to achieve equality for Aboriginal and Torres Strait Islander peoples in areas like education, health and employment. In today’s infographic, we share some of the education results and how they compare to the baseline year data.
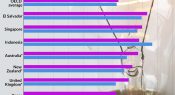
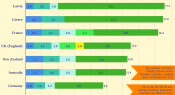
Do you encourage your students to come up with original answers? Do you also give them enough time to be creative in assignments? Our latest infographic looks at data from the PISA 2022 creative thinking questionnaire. We look at 10 of the participating countries and economies, and the percentage of students who agreed with the 2 statements about encouragement and time
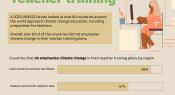
Climate change education provides students with the knowledge required to understand and practice climate action. Several UNESCO studies offer international insights into what students know, how confident teachers are on the topic, teacher training plans and current curriculum content. Find out more in this infographic.
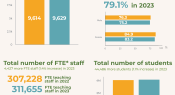
The annual Australian Bureau of Statistics (ABS) report on the number of schools, students and staff across Australia in 2023 has been released. In this infographic, we look at some of the latest figures and compare them to the same figures recorded for 2022.
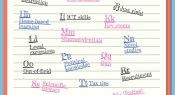
What do you need information on? Explicit instruction? Design thinking? Scientific literacy? Student anxiety? The 13th Teacher alphabet brings you quick links to popular content that you might find useful. Download the PDF for a hyperlinked version so you can access the content for each letter.
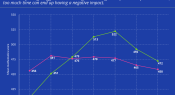
According to mathematics performance data from the OECD's PISA 2022 report, students that spend time at school learning on digital devices outperform students that don't. But how much time is too much time? In today’s infographic, we look at student mathematics scores across the OECD and Australia by hours spent on digital learning at school.
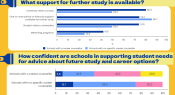
Recent research provides insights into careers education and activities that Australian students have access to at school to support their preparation for the future. The data was collected from 259 schools and in this infographic, we compare the findings for schools with a career counsellor and schools with no specific career counsellor.
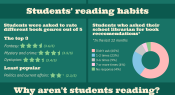
A Deakin University study delves into secondary school students’ reading habits and explores the prevalence of reading for pleasure amongst teenagers. In this infographic we share some of the findings.
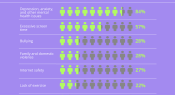
How well do you know the issues facing your students? Beyond Blue asked Australian teachers to name the top 3 health issues facing people under 18. In today’s infographic, we look at the 10 most common responses.
Do you feel like you’re getting enough time off each year? Recent data from the OECD’s Education at a Glace report reveals Australian primary school teachers and students have less time off each year than the majority of OECD countries measured.
Facebook
YouTube
SoundCloud
Apple Podcasts
Spotify
RSS feed
Linkedin