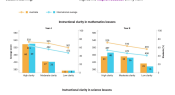
Latest Trends in International Mathematics and Science Study (TIMSS) data show the degree to which teachers are clear in the way they deliver the mathematics and science curriculum is likely to influence student learning. This includes ensuring students understand the learning goals for each lesson, being able to explain key concepts, and giving students helpful feedback. Find out more in this infographic.
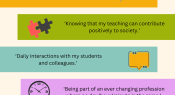
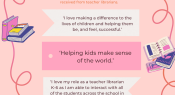
In our latest annual reader survey, we asked you what you love about your role. In this infographic, we share some of the responses we received from classroom teachers.
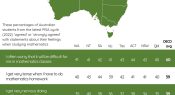
Each cycle of the Programme for International Student Assessment (PISA) includes a student questionnaire. One topic – mathematics anxiety – is characterised by feelings of tension, fear or apprehension when a person is faced with mathematics-related tasks. Today’s infographic provides useful prompts for teachers when considering their own students.
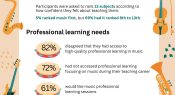
New findings from a survey of over 700 teachers across 95 primary schools in New South Wales shine a light on their current understanding and own experience of music education. Here are some of the survey results on teacher confidence and professional learning.
In our latest annual reader survey, we asked you what you love about your role. In this infographic, we share some of the responses we received from teacher librarians.
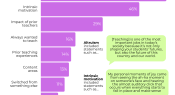
A US study has explored the different reasons why pre-service teachers (PSTs) decided to pursue a teaching career. Researchers analysed roughly 2,800 essay responses and identified 10 ‘supertopics’. The most common supertopic, appearing in nearly 60% of essays, was ’altruism’, followed by ‘intrinsic motivation’. This infographic gives an overview of the results.
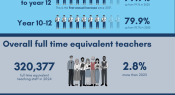
The Australian Bureau of Statistics release data on schools, staff and students in Australia each year. The latest data for 2024 show increases from 2023 in student retention, full-time equivalent teaching staff, and student enrolment.
As a teacher, knowing the words your students frequently use in their writing can help you understand where to extend their spelling and vocabulary skills. The 2024 Oxford Children’s Word of the Year report reveals words frequently used by primary aged children in their writing.
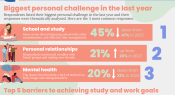
The latest annual Youth Survey by national charity Mission Australia received responses from 17,480 young people (aged 15-19) around the country on issues important to them in 2024. Here, we look at the top personal challenges they are facing.
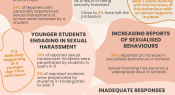
A recent survey of more than 1,000 K-12 teachers working in Australian schools has found 47% (almost all female) have experienced sexual harassment within a school environment. Here we share the 6 key findings from the survey and some of the responses from participants.
Facebook
YouTube
SoundCloud
Apple Podcasts
Spotify
RSS feed
Linkedin