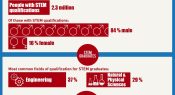
A recent report from the Australian Council for Educational Research explored gender differences in relation to STEM participation, achievement and engagement. Here are some of the results.
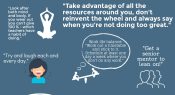
The 2016 Teacher reader survey includes the question: "Looking back on your experience as an educator, if you could share a piece of advice with your peers, what would it be?" Here are some of our favourite responses so far on the topic of wellbeing.
From online videos to digital comics and video games – there are countless different ways teachers can use technology to support their lessons. So how are teachers using networked technologies in the classroom? Find out in this Teacher infographic.
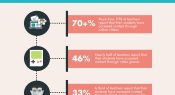
The OECD Teaching and Learning International Survey (TALIS) 2013 asked lower secondary education teachers about the distribution of class time during the average lesson. So, how much time is actually spent on teaching and learning? Find out in this Teacher infographic.
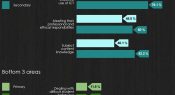
In the experience of Australian Principals, how well prepared are recent teacher graduates in relation to areas such as dealing with difficult student behaviour, making effective use of ICT, and subject content knowledge? Find out in today's infographic.
School educators are being encouraged to give students more information about STEM-related careers. So, what are the top occupations of STEM graduates? Find out in this Teacher infographic.
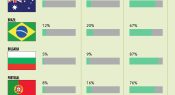
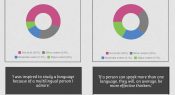
Do students choose a language in Year 12 because it will help their ATAR score? Is their decision influenced more by future career plans or their parents? Today's infographic looks at students' reasons for studying a language in Year 11 and 12.
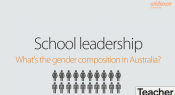
What do you think the gender mix is for school leadership roles? How did it change between 2010 and 2013? Are more women moving into school leadership positions? Find out in this video infographic.
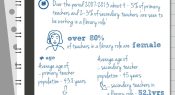
What is the percentage of Australian teachers working in school libraries? Are those teachers mainly female or male? Find out in this infographic.
Has the gender balance of teaching staff in Australian schools changed over the last decade? Find out in this video infographic.
Facebook
YouTube
SoundCloud
Apple Podcasts
Spotify
RSS feed
Linkedin