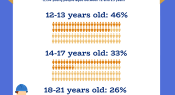
It's well-known that women are underrepresented in participation in STEM education and the STEM workforce. The 2021 Youth in STEM study surveyed participants about their awareness and perception of STEM subjects and careers. As this infographic shows, the findings reveal age is important for girls when it comes to interest in studying engineering.
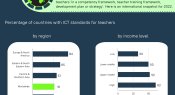
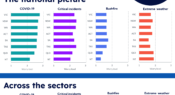
UNESCO’s Global Education Monitoring Report for 2023 focuses on technology in education. According to the report’s Profiles Enhancing Education Reviews for 211 education systems, 51% have set ICT standards for teachers ‘in a competency framework, teacher training framework, development plan or strategy’. Here is an international snapshot for 2022.
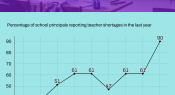
A growing number of school leaders across Australia are reporting problems with unfilled teacher vacancies. The Australian Education Union’s annual ‘State of our Schools Survey’ includes a question for principals on teacher shortages. In the latest survey, 9 out of 10 principals reported experiencing a shortage of teachers in the last year – more than triple the rate in 2015. Find out more in this infographic.
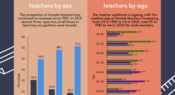
Australian Bureau of Statistics analysis of 2021 Australian Census data includes insights into how the teacher workforce has changed over the last 40 years. In this infographic, we share how the distribution of teachers by age and sex has changed over the past 40 years.
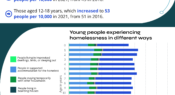
Many students face personal challenges and hardship outside the school grounds, and this can have a negative impact on their health and education. Data published in 2023 explores 2021 Census data to give insight into the estimated number of people experiencing homelessness. Here, we share some of the data relating to those under the age of 18.
Understanding the key concerns of your school staff can help inform professional development and supports provided. A recent survey asked teachers working in preschool to year 12 settings to share how often they worry about COVID-19 and other extreme events, such as natural disasters and critical incidents.
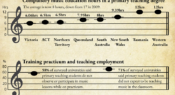
The new Fading Notes report explores the provision of music education in Australian primary teaching degrees. Researchers surveyed lecturers responsible for music education within Initial Teacher Education degrees, representing a student pool of more than 4,600 primary teaching students across 73% of universities delivering generalist primary teaching degrees. Topics included music training hours, and knowledge, skills and competency to teach. Here are some of the results.
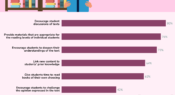
Recently released survey data from PIRLS 2021 (Progress in International Reading and Literacy Study) includes information on reading instruction strategies used in year 4 lessons. This infographic shows the percentage of Australian PIRLS 2021 students whose teachers reported using these strategies in every or almost every lesson.
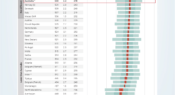
The new report, Progress in International Reading Literacy Study: Australia’s results from PIRLS 2021, reveals how the average reading performance of year 4 students in Australia compares to other countries. Find out more in today’s infographic.
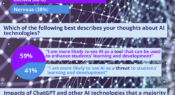
A new report from McCrindle outlines 7 disruptors impacting the future of education, informed by survey data. One identified disruptor is artificial intelligence and technological change. In this infographic, we share some of the survey results for questions on artificial intelligence and technological change.
Facebook
YouTube
SoundCloud
Apple Podcasts
Spotify
RSS feed
Linkedin